The Keltner Channel strategy is a technical indicator that traders use to help make sense of price movement.
It’s a type of chart overlay that shows how far the price usually moves over time and helps highlight when something atypical might be happening, like a breakout or the start of a trend.
If you’ve heard of Bollinger Bands, Keltner Channels are similar, but they’re based on different maths.
Instead of using standard deviation, they rely on something called the average true range (ATR), which measures how much the price typically moves in a session.
That makes them smooth and easy to read, especially in trending markets.
In this article, we’ll walk through what the Keltner Channel actually is, how it’s built, and how traders use it in real life.
Whether you’re new to chart patterns or want to sharpen your entries and exits, this strategy can be a helpful part of your trading toolkit.
What is the Keltner Channel Strategy?
The Keltner Channel is a technical indicator used on price charts to help traders spot trends, breakouts, and potential reversal zones.
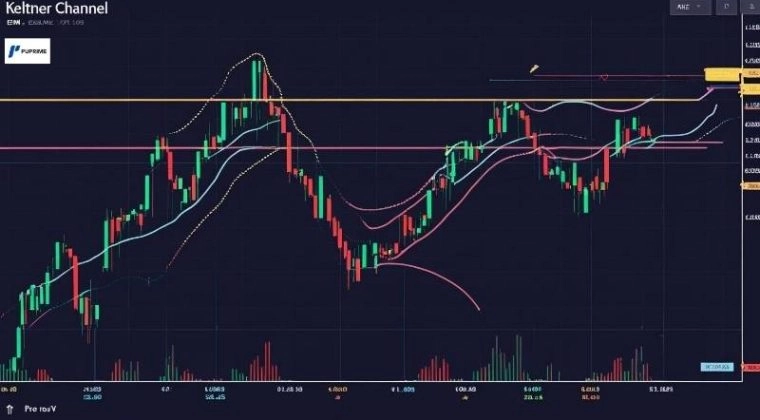
It creates a channel around price, made up of three lines: a middle line and two outer bands.
Here’s how it works:
- The middle line is an Exponential Moving Average (EMA) – usually a 20-period EMA. This line follows the price closely and acts as the centre of the channel.
- The upper and lower bands are placed above and below the EMA using a multiple of the Average True Range (ATR). The ATR measures how much the price typically moves, so the channel adjusts based on market volatility.
Keltner Channel Formula
While you don’t need to calculate it manually (your trading platform will do it), here’s the basic formula:
- Middle Line = 20-period EMA of the closing price
- Upper Band = EMA + (2 × ATR)
- Lower Band = EMA − (2 × ATR)
Some traders use 1.5 or 2.5 times the ATR, depending on how tight or wide they want the channel to be.
Because it’s based on the average range of movement, the Keltner Channel adapts to the market.
If things are calm, the bands get tighter. If volatility picks up, the bands expand.
This makes it useful for spotting breakouts, managing trades, or simply understanding when the price is moving outside its normal range.
How the Keltner Channel Strategy Works
The Keltner Channel adjusts automatically to price movement and volatility, which is what makes it so useful in fast-moving markets.
When prices are calm, the bands stay tight. When things get more active, the bands widen.
At the core of the strategy is the idea that price usually stays within the channel.
So, when price breaks above the upper band or below the lower band, it can signal something important is happening, like a breakout or the start of a new trend.
- In a strong uptrend, price often rides near or above the upper band, showing strength and momentum.
- In a downtrend, the price will often hug or dip below the lower band, showing weakness.
- When the price moves sideways, the channel stays relatively flat and narrow. This can help spot periods of consolidation before the next big move.
The width of the channel is key.
Wider bands mean more market volatility (price is swinging around more).
Narrower bands often tell the market is quiet, and a breakout could be coming.
Traders use this to their advantage.
A break outside the channel might be a signal to enter a trade, while a return inside the bands might suggest things are returning to normal.
Either way, the Keltner Channel Strategy can help you put price action into context.
It shows not just where the price is, but how significant that move might be based on recent behaviour.
Best Keltner Channel Settings
There’s no one-size-fits-all when it comes to Keltner Channel settings, but most traders start with the default setup: a 20-period Exponential Moving Average (EMA) for the middle line, and 2 times the Average True Range (ATR) for the channel width.
That setting gives a good balance for general trend-following and breakout strategies, but depending on your trading style, you might want to tweak it.
For Short-Term Traders
If you’re trading on shorter timeframes (like 5-minute or 15-minute charts), you may prefer a faster EMA – say, 10 or 15 periods – and a smaller ATR multiplier like 1.5.
This tightens the channel and can help you catch quicker price moves.
For Swing or Long–Term Traders
If you’re holding trades for days or weeks, a slower EMA (like 20 or 30 periods) and a wider ATR multiplier (2 or even 2.5) may be more appropriate.
This can smooth out market noise and give cleaner signals based on bigger-picture trends.
Matching Settings to Market Conditions
- In volatile markets, consider a wider ATR multiplier. It gives the price more room to move without constantly breaking outside the channel.
- In calm or ranging markets, a tighter channel might help spot early breakouts before momentum picks up.
Whatever settings you choose, consistency is essential.
Test your setup on historical data and stick with it for a while to see how it behaves in real time.
Adjusting is fine, but avoid over-tweaking based on a few trades.
The goal is to build confidence in how your Keltner Channel responds to the market you’re trading.
Using the Keltner Channel Strategy
The Keltner Channel can help you spot real trading opportunities by showing you when the price is moving outside its usual range.
Here’s how traders typically use it.
Spotting Potential Trade Setups
When price pushes above the upper band, it can suggest intense buying pressure, sometimes the start of a breakout.
When price dips below the lower band, it can signal intense selling pressure or a potential breakdown.
These moves can be used as possible entry points, especially if they line up with other indicators or chart patterns.
Identifying Dynamic Support and Resistance
The middle EMA line often acts like a moving support or resistance level. In an uptrend, the price may pull back to the EMA before moving higher again.
In a downtrend, the price might bounce off the EMA on the way down.
Traders use this as a guide for pullback entries or stop placement.
Recognising Overbought or Oversold Conditions
If price stretches far outside the channel and then starts to slow down, it may be overbought (above the upper band) or oversold (below the lower band). This doesn’t mean price will reverse immediately, but it can be a signal to watch for slowing momentum or potential consolidation.
Looking for Breakout Confirmation
When the channel tightens (meaning volatility is low) and then price breaks above or below the bands on rising volume, that can be a strong breakout signal.
Many traders seek confirmation from other indicators, such as RSI or MACD, before entering.
The Keltner Channel provides a framework for determining whether price action is strong, weak, or stretched.
It works well in trending markets and can help add structure to your entries, exits, and stop placement.
Like all strategies, it’s best used with clear risk rules and a bit of practice before going live.
Combining Keltner Channels with Other Indicators
While Keltner Channels are powerful on their own, they can work better when paired with other tools.
No single indicator is perfect; each has its own strengths and blind spots.
By combining a few, you can reduce false signals and potentially make more confident decisions.
Keltner Channels + Bollinger Bands
This is a popular combination. Keltner Channels use average true range (ATR), while Bollinger Bands are based on standard deviation.
If both bands tighten at the same time, it can signal that a big move is coming.
Some traders watch for when Bollinger Bands move inside the Keltner Channel, known as a “squeeze.”
This suggests the market is unusually quiet and may be ready to break out.
Keltner Channels + RSI (Relative Strength Index)
While Keltner Channels show price relative to its recent range, RSI shows whether the market is overbought or oversold.
If price hits the upper band and RSI is also in overbought territory, it may signal that a short-term pullback is coming.
The reverse applies when the price touches the lower band and the RSI shows oversold.
Keltner Channels + Moving Averages
Adding a longer-term moving average (like a 50- or 200-period) helps you stay aligned with the broader trend.
You might only take long trades above the moving average and short trades below it.
This filters out setups that go against the main market direction.
Keltner Channels + MACD
MACD helps confirm momentum. If price breaks above the upper band and MACD shows a fresh bullish crossover, that adds weight to a long trade.
The same goes for bearish signals at the lower band.
The key is to find indicators that complement each other without overcrowding your chart.
You’re not looking for perfect agreement, but when multiple tools point to the same setup, it can give you more confidence to act.
Always test your combinations on historical data and in a demo account before relying on them in live trades.
Some Advantages and Limitations
Like any trading tool, the Keltner Channel has its strengths and some limitations.
Knowing both can help you use it more effectively and potentially avoid common pitfalls.
Advantages
- Adapts to volatility: Because the channel is based on average true range (ATR), it automatically widens or tightens depending on how much the market is moving. This makes it worthwhile in both calm and fast-moving conditions.
- Clear structure: The middle line (EMA) and outer bands give you a simple visual guide for spotting trends, breakouts, and pullbacks.
- Works well with other tools: The Keltner Channel blends easily with other indicators like RSI, MACD, and moving averages, helping confirm signals and filter out weaker setups.
- Good for trend and swing trading: Many traders use Keltner Channels to stay in trends longer, or to time entries during brief pullbacks.
Limitations
- False signals: Like any indicator, Keltner Channels can generate false breakouts, especially in choppy or sideways markets. That’s why it can be a good idea to combine it with volume or a second indicator for confirmation.
- Not ideal for all markets: It tends to perform better in trending conditions. In flat markets, prices may whip between the bands without a clear direction, making it harder to read.
- Doesn’t show reversals: Keltner Channels highlight momentum and rang,e but aren’t designed to predict major turning points. If you’re looking for early reversal signals, you may need other tools.
Used thoughtfully, the Keltner Channel can be a reliable guide.
But no indicator is perfect.
The best results often come when you understand its role, combine it with sound risk management, and test it thoroughly on your chosen market and timeframe.
When to Use the Keltner Channel Strategy
The Keltner Channel strategy tends to perform best in specific market conditions.
Knowing when to use it and when to be cautious can make a big difference in how well it works for you.
Trending Markets
This strategy is most effective when the market is clearly moving in one direction.
In an uptrend, the price often rides the upper band, and in a downtrend, it stays near the lower band.
The channel helps confirm the strength of the move and can guide entries during pullbacks to the middle line.
Volatility Changes
Because the Keltner Channel is based on average true range (ATR), it naturally adjusts to volatility.
When the channel starts to tighten, it may signal that a breakout is coming.
When it widens, it confirms that volatility has picked up and the trend may be gaining strength.
Breakout Setups
If the price has been sitting inside a narrow range and then breaks above the upper band or below the lower band, it could be the start of a new trend.
Keltner Channels help you spot these moments without guessing.
Avoid During Flat Markets
In sideways or range-bound conditions, the Keltner Channel isn’t always reliable.
Price can fluctuate between the bands, creating noise and potential false signals.
If the middle line is flat and the bands aren’t expanding or contracting meaningfully, it might be better to wait for clearer conditions.
In short, the Keltner Channel works best when the market is moving, not drifting.
It helps you catch trends, spot breakouts, and stay aligned with momentum, especially when paired with other confirmation tools.
Next Steps in Your Trading Journey
The Keltner Channel strategy is a flexible trading tool that helps you better understand how the price behaves in different market conditions.
Whether you’re tracking a trend, looking for breakout opportunities, or trying to avoid overbought or oversold trades, the channel gives structure to your decision-making.
Because it’s built around average true range and an EMA, it adapts smoothly to market volatility, offering cleaner signals than some other indicators.
Still, like any tool, it’s not perfect.
Keltner Channels work best when used with other indicators, solid risk management, and a clear understanding of the market environment.
If you’re new to this strategy, start by testing it in a demo account or on historical charts.
Over time, you’ll build the experience needed to know when it fits your trading style, and when to sit on the sidelines.
Try PU Prime Today
Want to put what you’ve learned into practice?
PU Prime gives you access to a wide range of markets through CFDs, including indices, forex, and more.
You can test spotting patterns like the bear flag pattern in a risk-free demo environment or explore real-time setups with flexible trading tools.
Head to PU Prime to learn more and see how the platform works for you.