The U.S. dollar secured its fifth consecutive session of gains, continuing its upward trajectory following a better-than-expected U.S. Retail Sales data.
The U.S. dollar secured its fifth consecutive session of gains, continuing its upward trajectory following a better-than-expected U.S. Retail Sales data. Robust economic indicators, including a rebound in the Consumer Price Index (CPI), have led to a recalibration of market expectations, reducing speculation about an imminent Federal Reserve rate cut. Consequently, the U.S. equity market faced significant selling pressure. Meanwhile, Asian markets experienced notable challenges, with China’s A50 index reaching its lowest level since 2019, and the Hang Seng Index recorded its most substantial decline in 15 months especially after China’s latest GDP data failed to meet expectations. In the commodities market, oil prices surged on reports of fresh U.S. strikes against Houthi rebels in the Red Sea, contributing to heightened geopolitical tensions.
Current rate hike bets on 31 January Fed interest rate decision:
Source: CME Fedwatch Tool
0 bps (98%) VS -25 bps (2%)
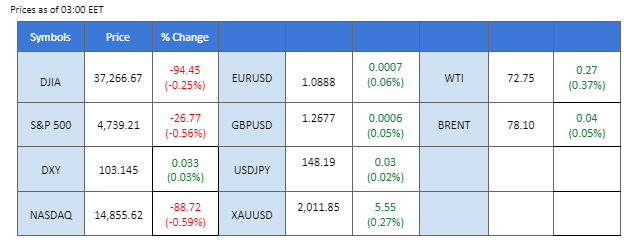
Market Overview
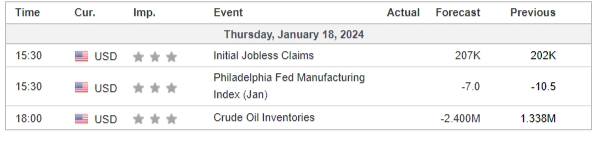
Economic Calendar
(MT4 System Time)
Source: MQL5
Market Movements
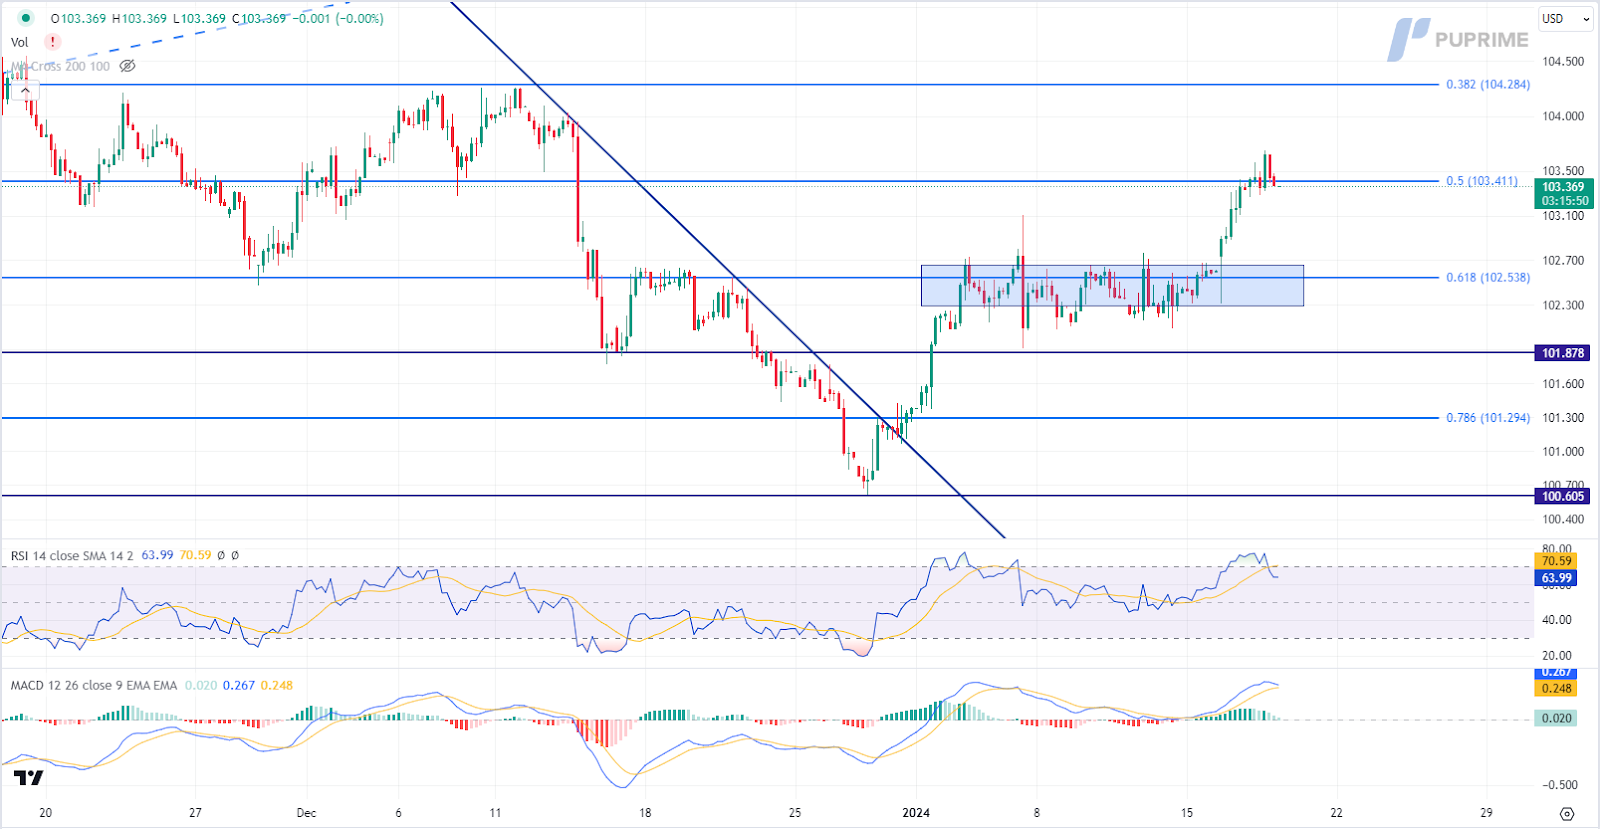
DOLLAR_INDX, H4
The Dollar Index surged to a fresh one-month high, propelled by a string of robust economic data, particularly the better-than-expected US Retail Sales figures. According to the Commerce Department’s Census Bureau, US Retail Sales rose by 0.6% last month, exceeding the market expectations of 0.40%. The upbeat economic indicators, combined with a hawkish tone from Fed Governor Christopher Waller, diminished hopes of an imminent interest rate cut by the Federal Reserve. US Treasury yields climbed higher, reflecting market sentiments, with the probability of a March rate cut now at 53.2%, down from the previous day’s 65.1%.
The Dollar Index is trading higher while currently testing the resistance level. However, MACD has illustrated diminishing bullish momentum, while RSI is at 64, suggesting the index might experience technical correction since the RSI retreated sharply from overbought territory.
Resistance level: 103.40, 104.30
Support level: 102.55, 101.90
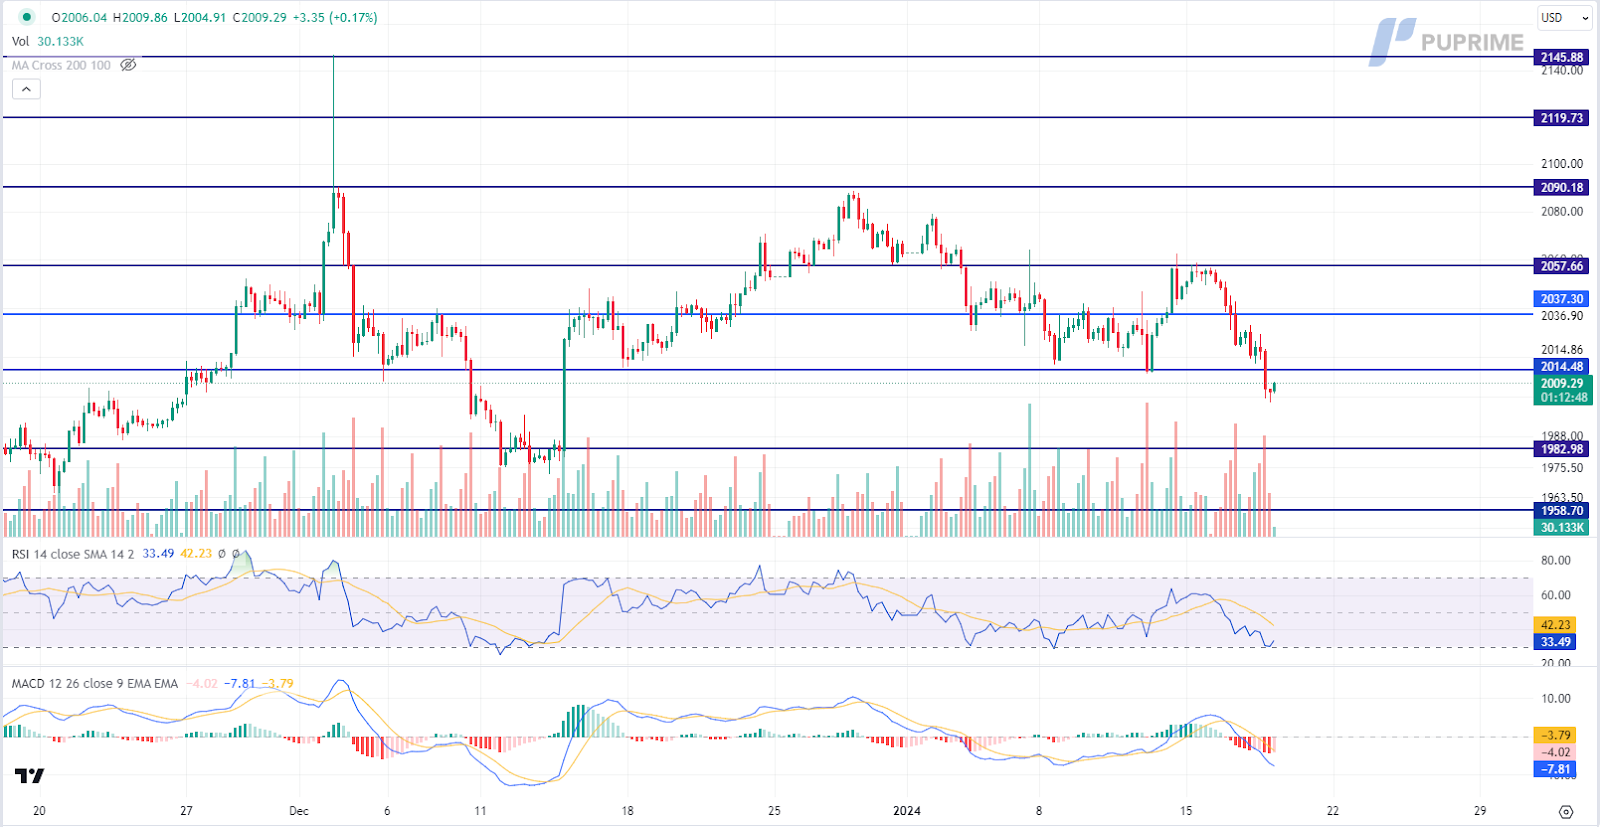
XAU/USD, H4
Gold prices continued their downward trajectory, facing headwinds from a strengthening US Dollar and diminishing expectations for a rate cut in March. The surge in US Treasury yields prompted a shift in investor portfolios away from non-yielding assets like gold. Despite these challenges, the geopolitical tensions in the Middle East maintained some support for gold, introducing a complex dynamic for traders navigating these contrasting factors.
Gold prices are trading lower following the prior breakout below the support level. However, MACD has illustrated diminishing bearish momentum, while RSI is at 33, suggesting the commodity might enter oversold territory.
Resistance level: 2035.00, 2055.00
Support level: 2015.00, 1985.00
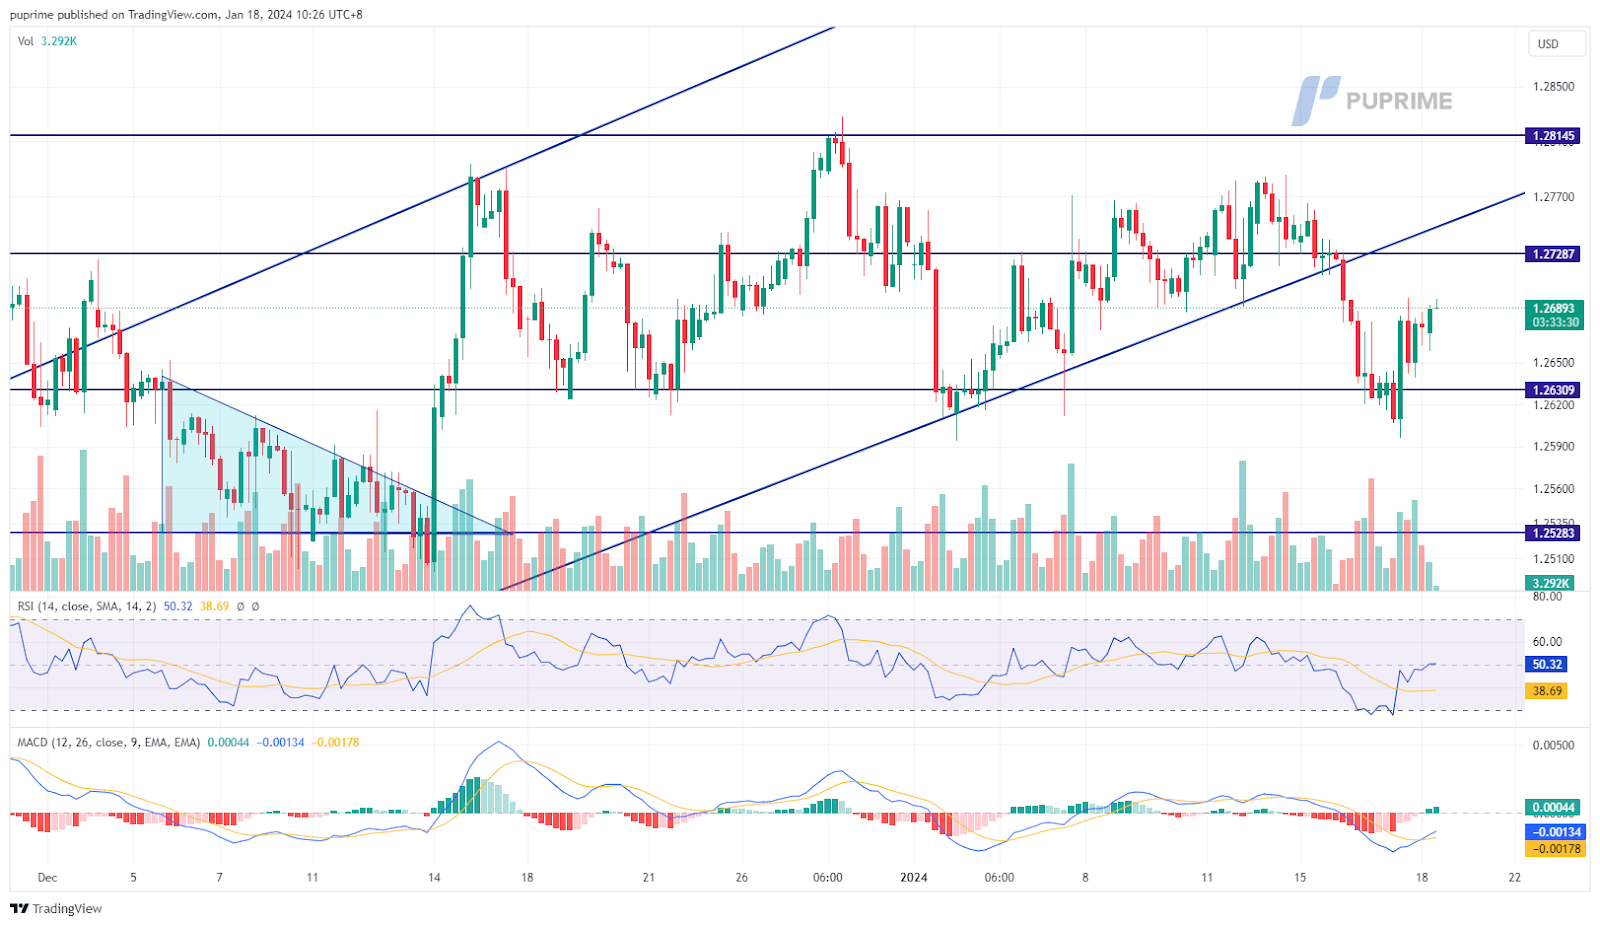
GBP/USD,H4
The Pound Sterling exhibited strength following the release of the UK’s Consumer Price Index (CPI), which surpassed market expectations. This robust inflation data has led to a perception that the Bank of England (BoE) may adopt a more hawkish stance in its upcoming monetary policy decisions to curb inflationary pressures. In contrast, the U.S. dollar, after a five-session winning streak, experienced some profit-taking sentiment. The bullish momentum that characterised the previous nights showed signs of easing.
GBP/USD rebounded strongly at its 1.2620 support level, suggesting the bearish momentum has drastically eased. The RSI has rebounded from the oversold zone while the MACD has crossed and is approaching the zero line from below, suggesting the bullish momentum is forming.
Resistance level: 1.2729, 1.2815
Support level: 1.2630, 1.2528
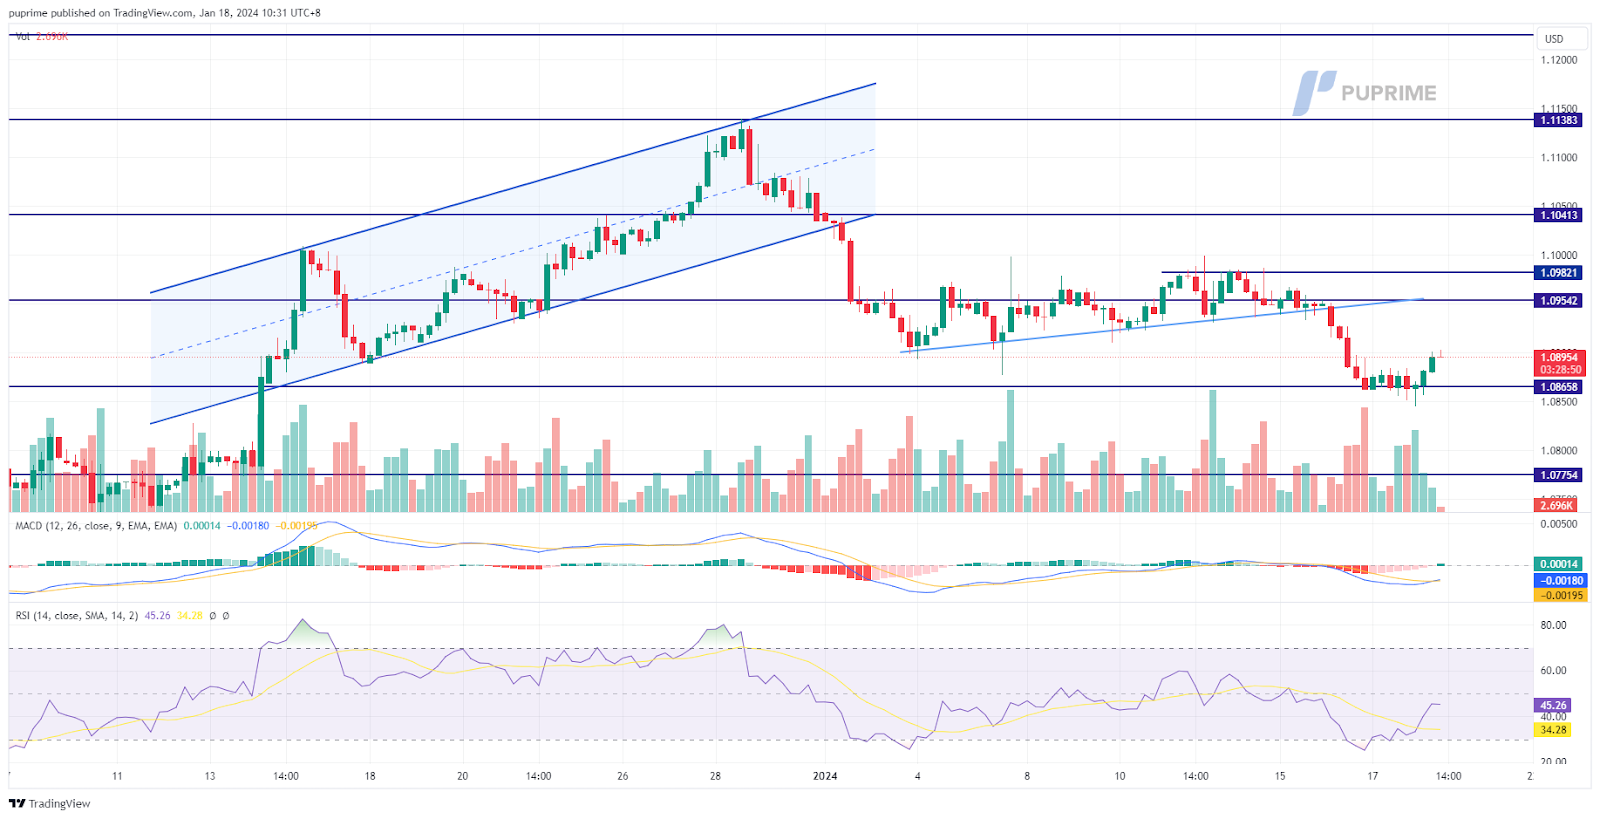
EUR/USD,H4
The EUR/USD pair experienced muted trading conditions but posted marginal gains as the recent strength in the U.S. dollar subsided. The Euro’s Consumer Price Index (CPI) reading aligned with market expectations, though it remains the lowest among its counterparts. The dollar’s bullish momentum eased after five consecutive sessions of gains, yet the lingering impact of upbeat economic data and a relatively hawkish stance from the Federal Reserve continues to support the greenback.
The EUR/USD pair traded with minimal volatility recently, suggesting a neutral signal for the pair. The RSI rebounded from the oversold zone while the MACD crossed below the zero line, suggesting the bearish momentum is easing.
Resistance level: 1.0954, 1.1041
Support level: 1.0866, 1.0775
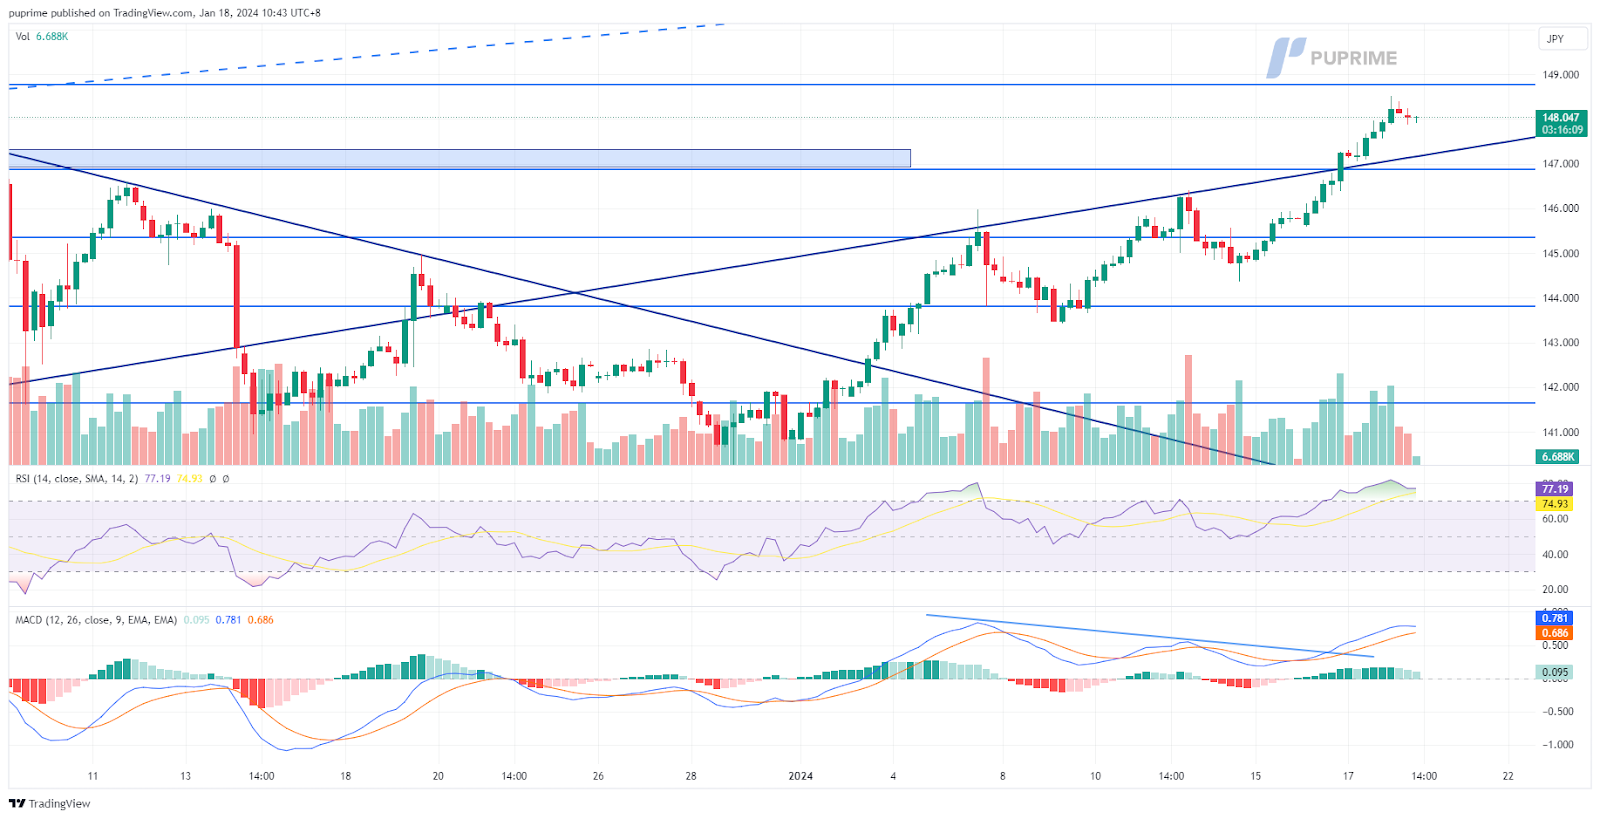
USD/JPY,H4
The USD/JPY pair maintains its upward trajectory as the U.S. dollar sustains gains driven by robust economic data. Yesterday’s Retail Sales figures exceeded market expectations, signalling a resilient U.S. economy and potentially delaying a Fed rate cut. The Japanese Yen, on the other hand, faces ongoing weakness as dovish expectations surrounding the Bank of Japan persist.
USD/JPY traded strongly and is hedging to its next resistance level at near 149. The RSI has been hovering in the overbought zone while the MACD continues to edge higher, suggesting the bullish momentum remains strong.
Resistance level: 148.88, 151.83
Support level: 146.90 145.35
AUD/USD, H4
The AUD/USD pair experiences significant downward pressure but discovers support around the 0.6530 level. Australia’s recent job data reveals a disappointing employment change of -65.1k, with the unemployment rate holding at 3.9%. The lacklustre job figures raise doubts about the Reserve Bank of Australia’s near-term interest rate hikes. Concurrently, the U.S. dollar shows signs of easing in its bullish trend following a five-session winning streak.
The AUD/USD pair has dropped to its crucial liquidity zone, while there is a sign of a technical rebound when the pair approaches that level. The RSI remains in the oversold zone while the MACD is on the brink of crossing below, suggesting the bearish momentum is slightly eased.
Resistance level: 0.6617, 0.6712
Support level: 0.6530, 0.6400
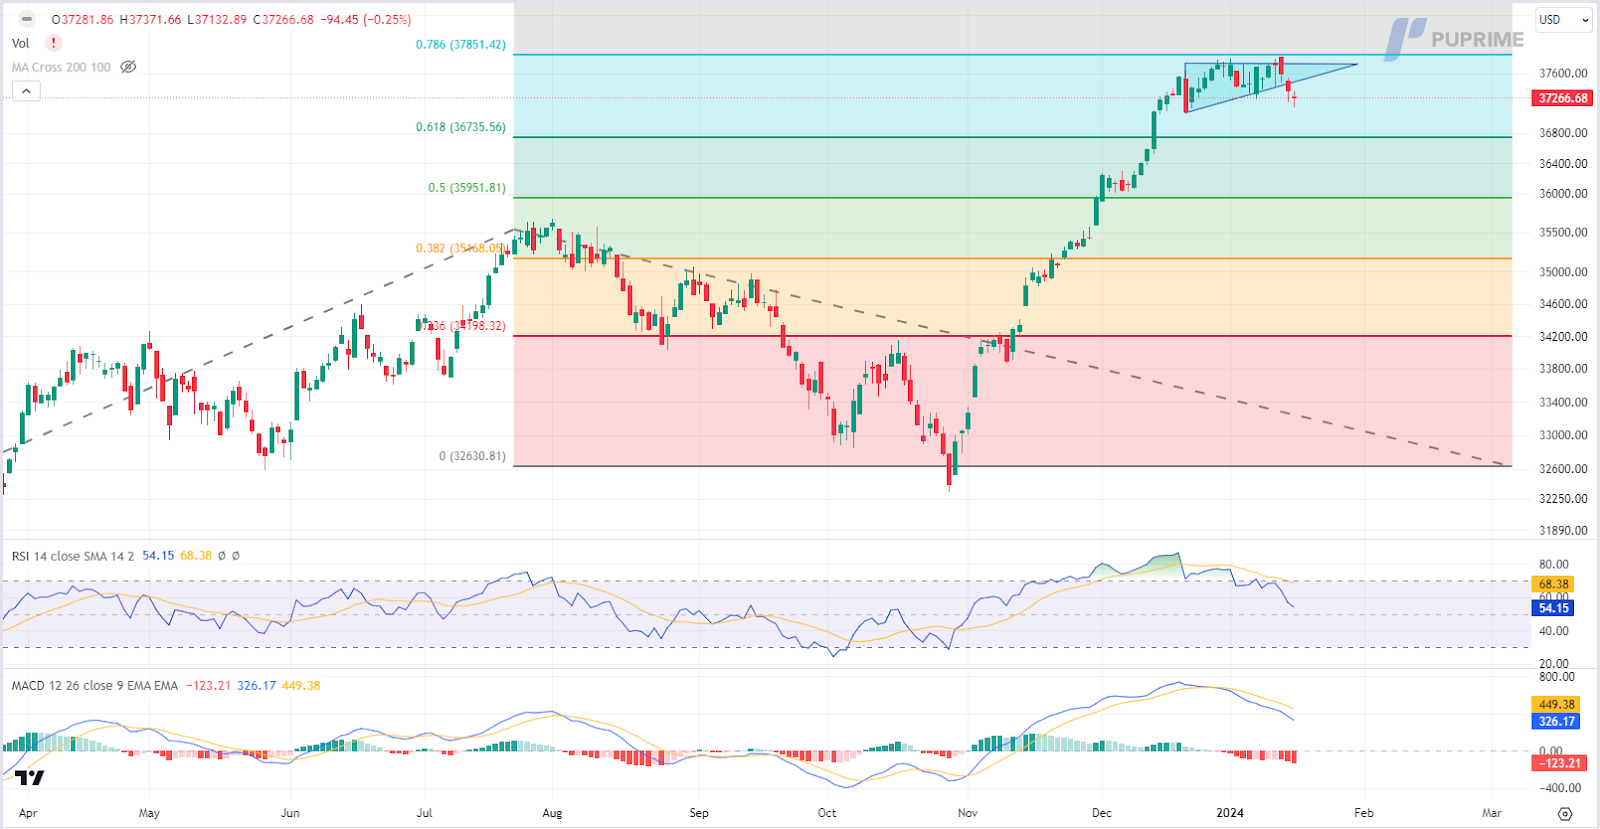
Dow Jones, Daily
US equity markets dipped as bond yields continued to climb, driven by speculation that the Federal Reserve might adopt a more measured approach to interest rate cuts, especially considering recent strong US economic data. Wall Street bankers echoed this sentiment, cautioning against aggressive bets on lower rates this year. The market’s recalibration raises uncertainties about the pace of future rate cuts, influencing investor strategies.
The Dow is trading lower following the prior retracement from the resistance level. MACD has illustrated increasing bearish momentum, while RSI is at 54, suggesting the index might extend its losses toward support level since the RSI retreated sharply from overbought territory.
Resistance level: 37850.00, 39275.00
Support level: 36735.00, 35950.00
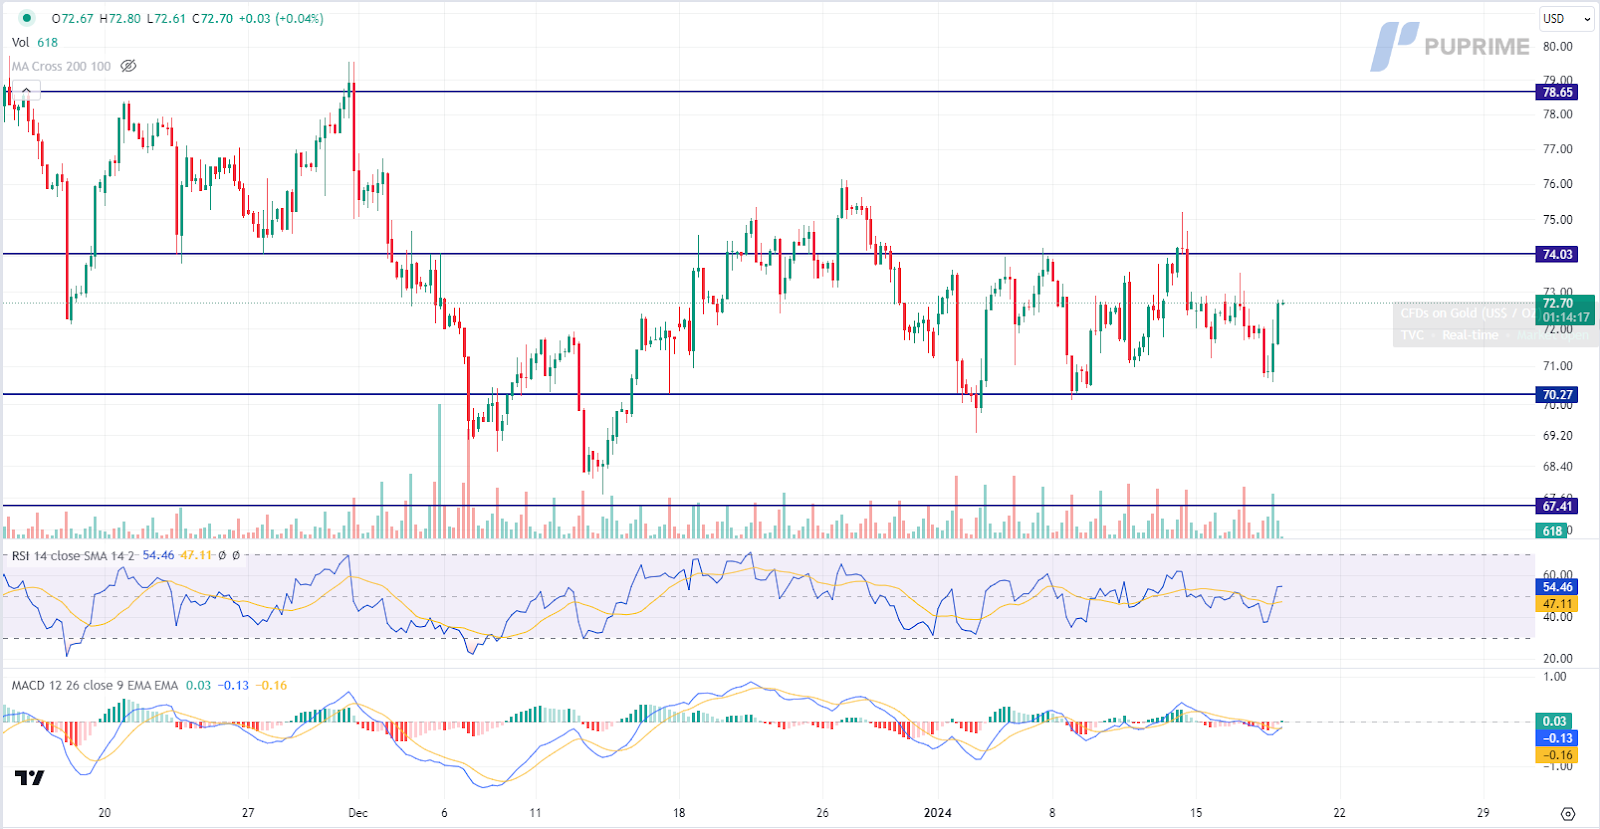
CL OIL, H4
Oil prices initially dipped in response to downbeat Chinese GDP data but rebounded following a positive outlook from OPEC+ in its monthly report. China’s GDP came in slightly lower than expectations, prompting concerns. However, a swift rebound occurred as OPEC+ presented an optimistic outlook for robust global oil demand in its monthly report. The group held its forecast for a strong 2.25 million barrels per day growth in demand for 2024, maintaining the previous month’s projection. Additionally, OPEC+ anticipated a 1.85 million barrels per day rise in world oil demand in 2025.
Oil prices are trading higher following the prior rebound from the support level. MACD has illustrated increasing bullish momentum, while RSI is at 54, suggesting the commodity might extend its gains toward resistance level since the RSI stays above the midline.
Resistance level: 74.00, 78.65
Support level: 70.25, 67.40
Inizia a Fare Trading con un Vantaggio
Scambia forex, indici, Metalli e altro ancora a spread bassi e con un'esecuzione fulminea.
Inizia a fare trading con depositi a partire da $50 sui nostri conti standard.
Ottieni accesso all’assistenza 24/7
Accedi a centinaia di strumenti, a strumenti didattici gratuiti e ad alcune delle migliori promozioni in circolazione.
Please note the Website is intended for individuals residing in jurisdictions where accessing the Website is permitted by law.
Please note that PU Prime and its affiliated entities are neither established nor operating in your home jurisdiction.
By clicking the "Acknowledge" button, you confirm that you are entering this website solely based on your initiative and not as a result of any specific marketing outreach. You wish to obtain information from this website which is provided on reverse solicitation in accordance with the laws of your home jurisdiction.
Ten en cuenta que el sitio web está destinado a personas que residen en jurisdicciones donde el acceso al sitio web está permitido por la ley.
Ten en cuenta que PU Prime y sus entidades afiliadas no están establecidas ni operan en tu jurisdicción de origen.
Al hacer clic en el botón "Aceptar", confirmas que estás ingresando a este sitio web por tu propia iniciativa y no como resultado de ningún esfuerzo de marketing específico. Deseas obtener información de este sitio web que se proporciona mediante solicitud inversa de acuerdo con las leyes de tu jurisdicción de origen.