In yesterday’s trading session, the U.S. dollar saw appreciable gains, buoyed by stronger-than-expected U.S. Retail Sales data. This robust economic indicator has led market participants to speculate that the Federal Reserve might delay any prospective rate cuts due to persistent inflationary pressures.
Amid ongoing geopolitical tensions in the Middle East, gold, a traditional safe-haven asset, climbed approximately 1.50%. This increase coincides with ongoing deliberations by Israeli officials on how to respond to recent Iranian hostilities, further stoking demand for safe-haven assets.
Additionally, oil prices experienced a significant rebound, driven not only by the escalating conflict in the Middle East but also by better-than-anticipated Chinese GDP figures. These data points suggest a potentially stronger demand for oil from China, adding upward pressure on prices.
Meanwhile, the Japanese yen weakened to its lowest level against the U.S. dollar in 34 years. In response to this depreciation, Japanese authorities have issued a warning that they are prepared to intervene in the market as necessary to stabilise the currency. This statement underscores the growing concerns about excessive volatility in exchange rates and its potential impact on the Japanese economy.
Current rate hike bets on 1st May Fed interest rate decision:
Source: CME Fedwatch Tool
0 bps (97%) VS -25 bps (3%)
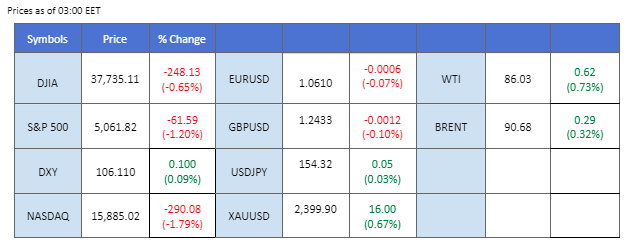
Market Overview
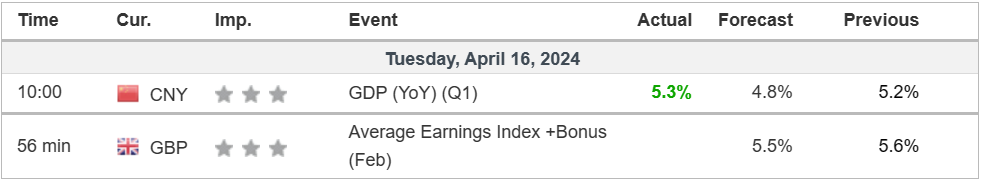
Economic Calendar
(MT4 System Time)
Source: MQL5
Market Movements
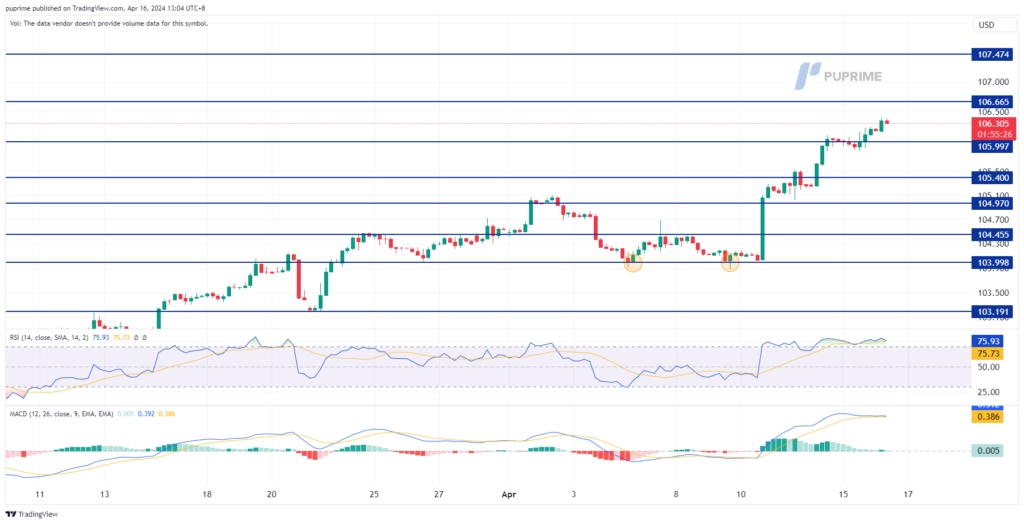
DOLLAR_INDX, H4
The Dollar Index surged to its highest level since early November, propelled by robust US retail sales data for March. With core retail sales surpassing expectations, market sentiment shifted towards delaying potential interest rate cuts by the Federal Reserve until September. The consensus among financial markets and economists now leans towards a later initiation of the easing cycle, with two rate cuts anticipated instead of the previously expected three.
The Dollar Index is trading higher following the prior breakout above the previous resistance level. However, MACD has illustrated diminishing bullish momentum, while RSI is at 78, suggesting the index might enter overbought territory.
Resistance level: 106.65, 107.45
Support level: 106.00, 105.40
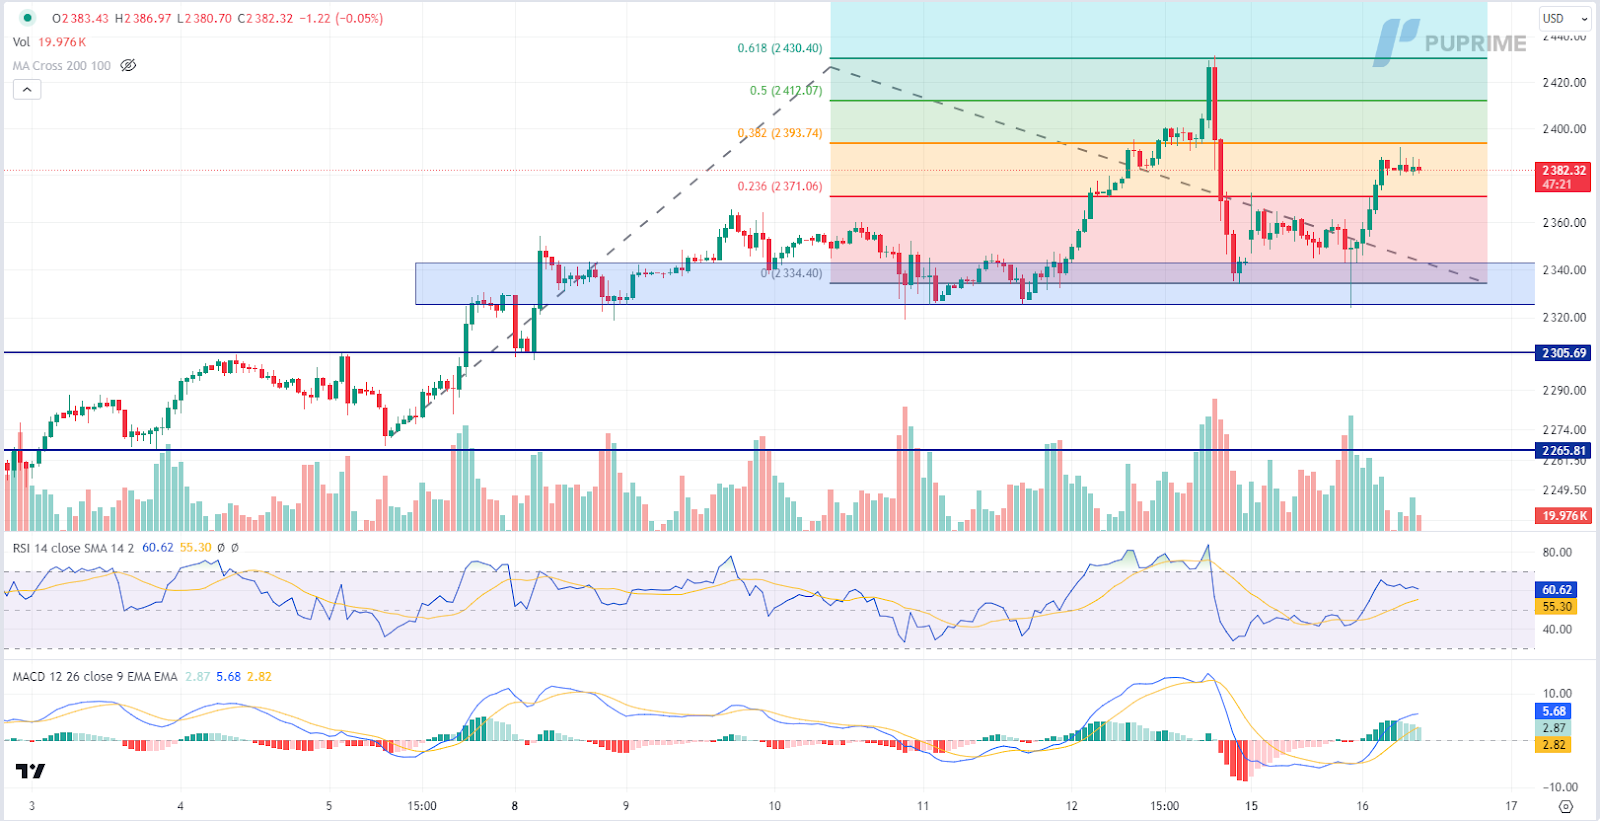
XAU/USD, H1
Initially, gold prices retreated as the better-than-expected retail sales report bolstered demand for the Dollar, dampening the appeal of gold as a dollar-denominated asset. However, persistent tensions in the Middle East kept risk appetite subdued in global financial markets, prompting a shift in sentiment towards safe-haven assets like gold. Ongoing geopolitical developments, particularly in the aftermath of Iran’s recent strike on Israel, continue to influence market dynamics.
Gold prices are trading higher following the prior breakout above the previous resistance level. However, MACD has illustrated diminishing bullish momentum, while RSI is at 60, suggesting the commodity might experience technical correction since the RSI retreated sharply from overbought territory.
Resistance level: 2395.00, 2410.00
Support level: 2370.00, 2335.00
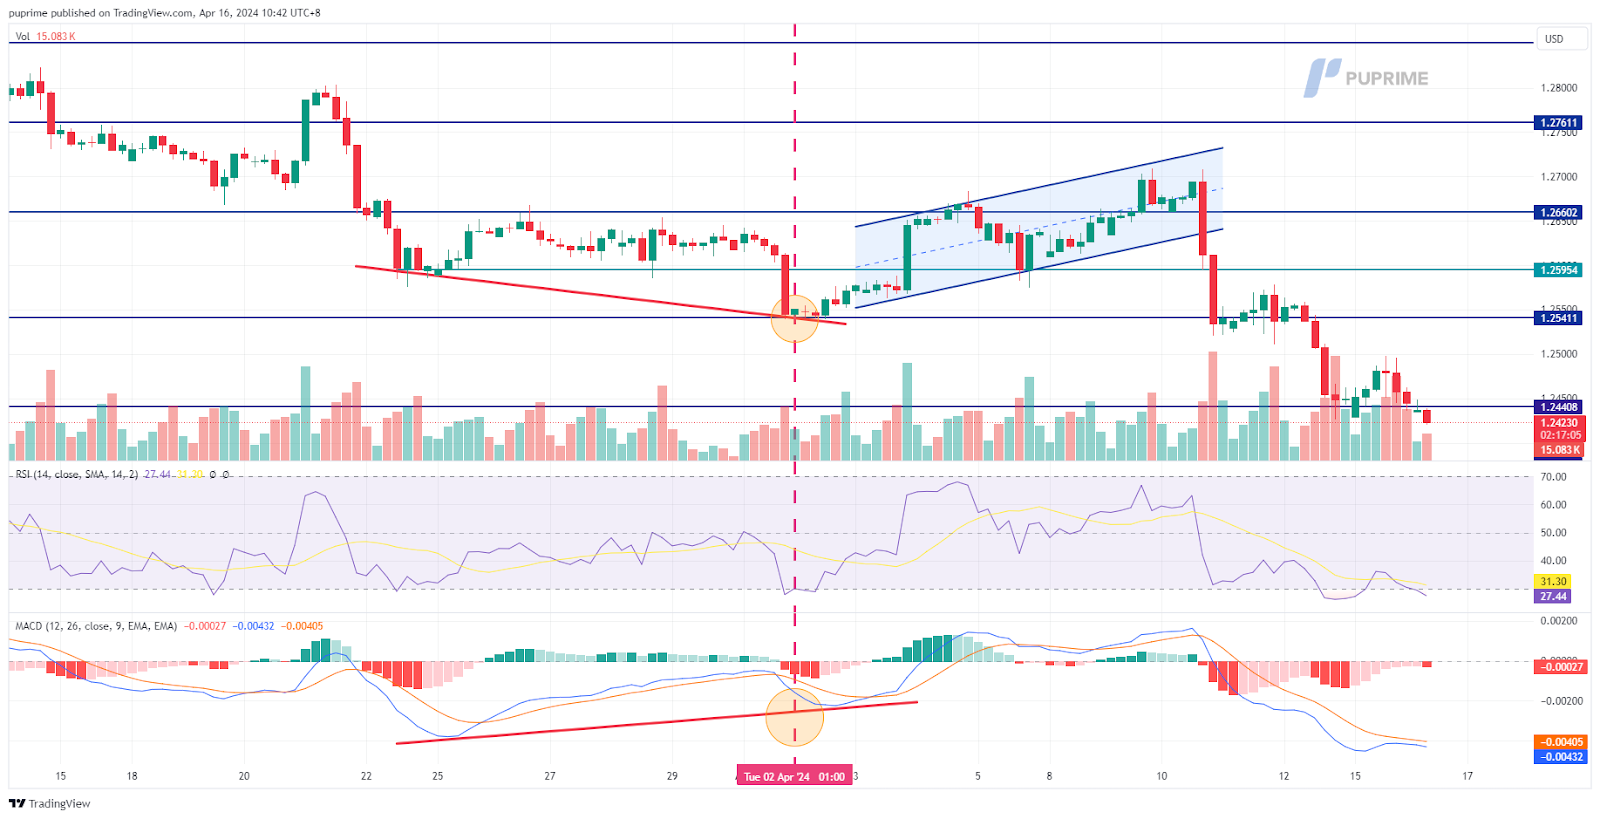
GBP/USD,H4
The GBP/USD pair remains under significant pressure, primarily driven by the strengthening U.S. dollar. Positive U.S. retail sales figures further bolstered the dollar, propelling the dollar index to its highest level seen in 2024. Market participants focused on the GBP are eagerly anticipating Wednesday’s release of UK GDP data. This data is expected to provide insights into the health of the Sterling and may influence trading dynamics surrounding the GBP/USD pair in the near term.
GBP/USD has broken its previous support level and is currently traded at its lowest level in 2024, suggesting a strong bearish momentum. The RSI hovers closely to the oversold zone while the MACD continues to edge lower, suggesting the bearish momentum remains strong.
Resistance level: 1.2540, 1.2660
Support level: 1.2370, 1.226
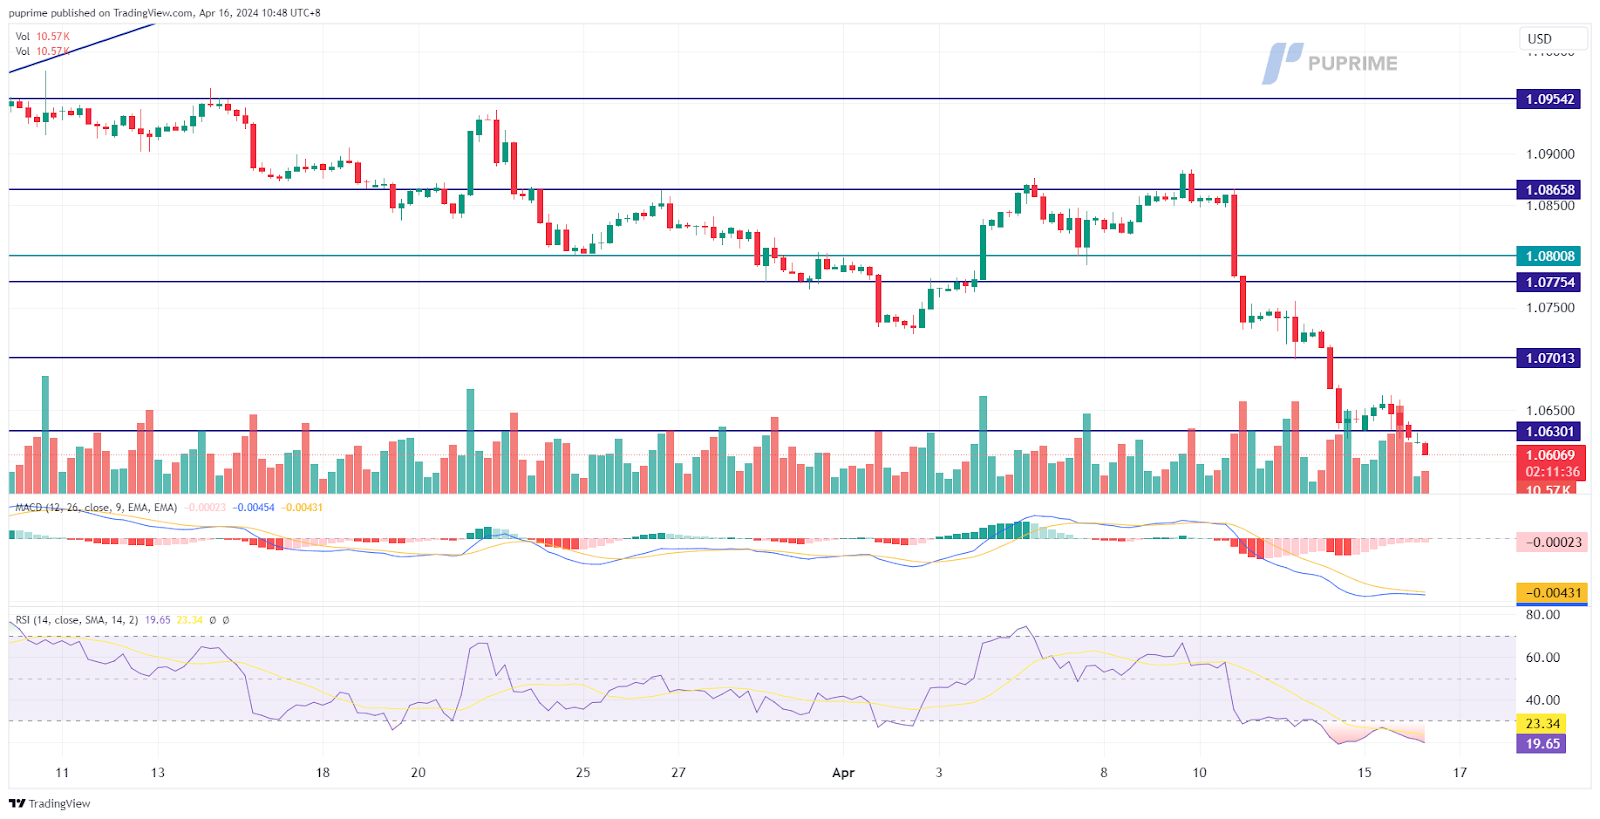
EUR/USD,H4
The EUR/USD pair has descended to its lowest level in five months, a decline fueled by the persistent strength of the U.S. dollar. The dollar’s momentum was further reinforced by robust U.S. economic data, notably the latest U.S. Retail Sales figures, which exceeded market expectations. Market participants are closely monitoring the upcoming release of the Eurozone’s Consumer Price Index (CPI) scheduled for Wednesday. This data release is anticipated to be a significant determinant of the pair’s future trajectory.
EUR/USD continues to trade with strong bearish momentum and has plunged by more than 2% since last week. The MACD continues to edge lower while the RSI has been flowing in the oversold zone suggesting the bearish momentum remains strong.
Resistance level: 1.0700, 1.0775
Support level: 1.0560, 1.0500
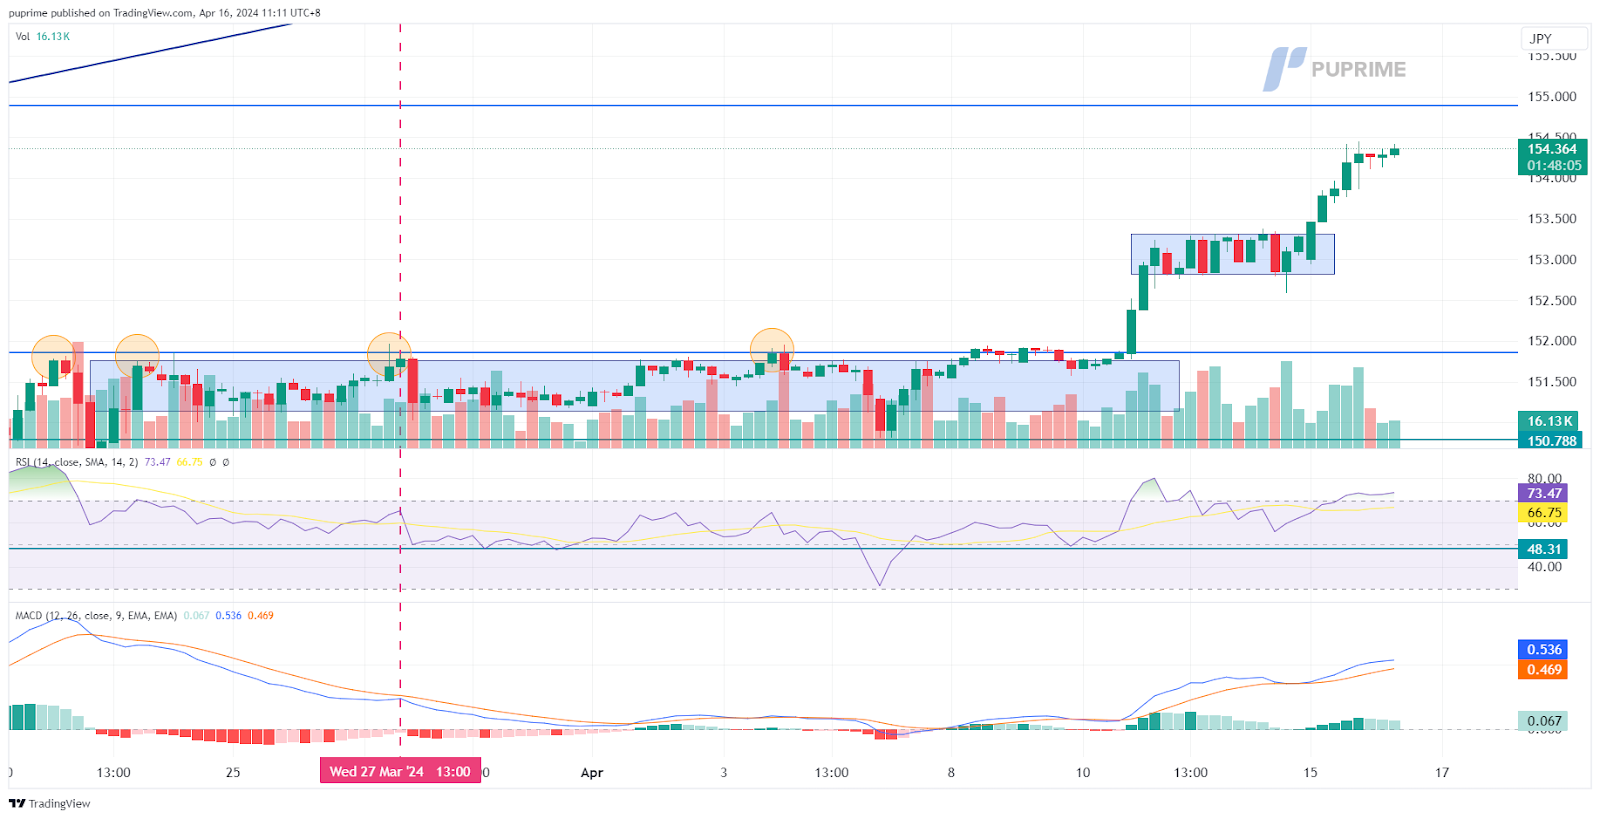
USD/JPY,H4
The Japanese yen (JPY) has depreciated to its lowest level against the U.S. dollar in 34 years. This decline comes as the U.S. dollar continues to strengthen, bolstered by robust U.S. economic data. The weakening yen may further escalate if no external interventions are made. In response to the yen’s rapid depreciation, Japanese authorities have signalled readiness to take decisive action in the markets to support the currency.
USD/JPY broke above its consolidation range, suggesting the pair continues to trade in a bullish trajectory. The RSI has broken into the overbought zone, while the MACD continues to edge higher, suggesting the bullish momentum remains strong.
Resistance level: 154.90, 156.50
Support level: 152.85, 151.90
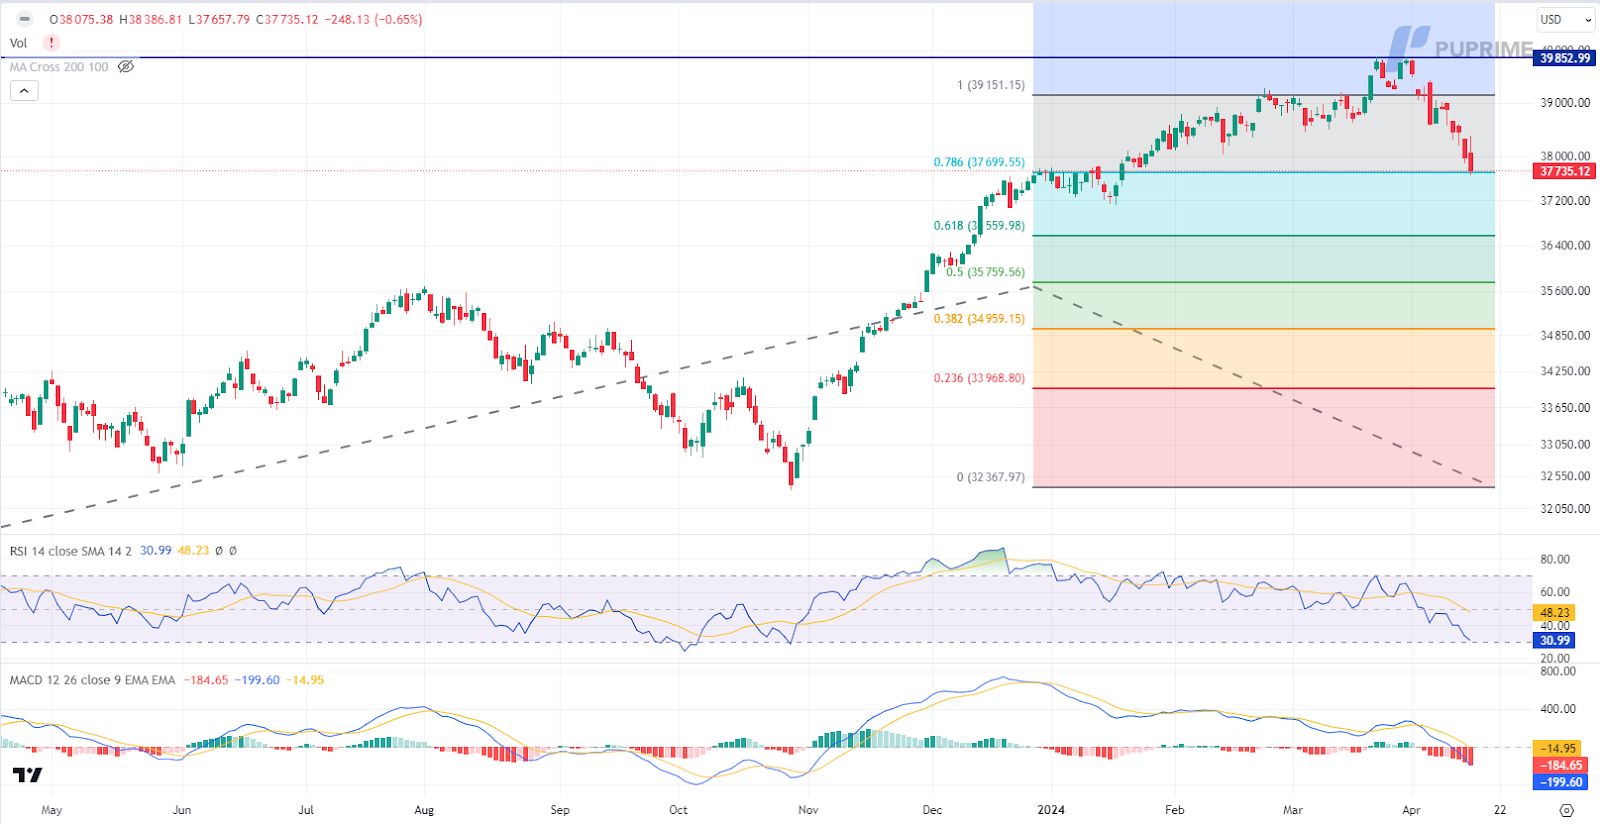
Dow Jones, H4
The spike in US Treasury yields, driven by stronger-than-expected retail sales growth in March, underscored consumer strength and bolstered expectations for robust US economic growth. The surge in 10-year Treasury yields to 4.61% diminished the allure of the US equity market, as investors reevaluated their risk exposure. Concurrently, global risk-off sentiment weighed on equity markets, further dampening investor sentiment.
The Dow is trading lower while currently testing the support level. MACD has illustrated increasing bearish momentum, while RSI is at 32, suggesting the index might extend its losses after breakout since the RSI stays below the midline.
Resistance level: 39150.00, 39855.00
Support level: 37700.00, 36560.00
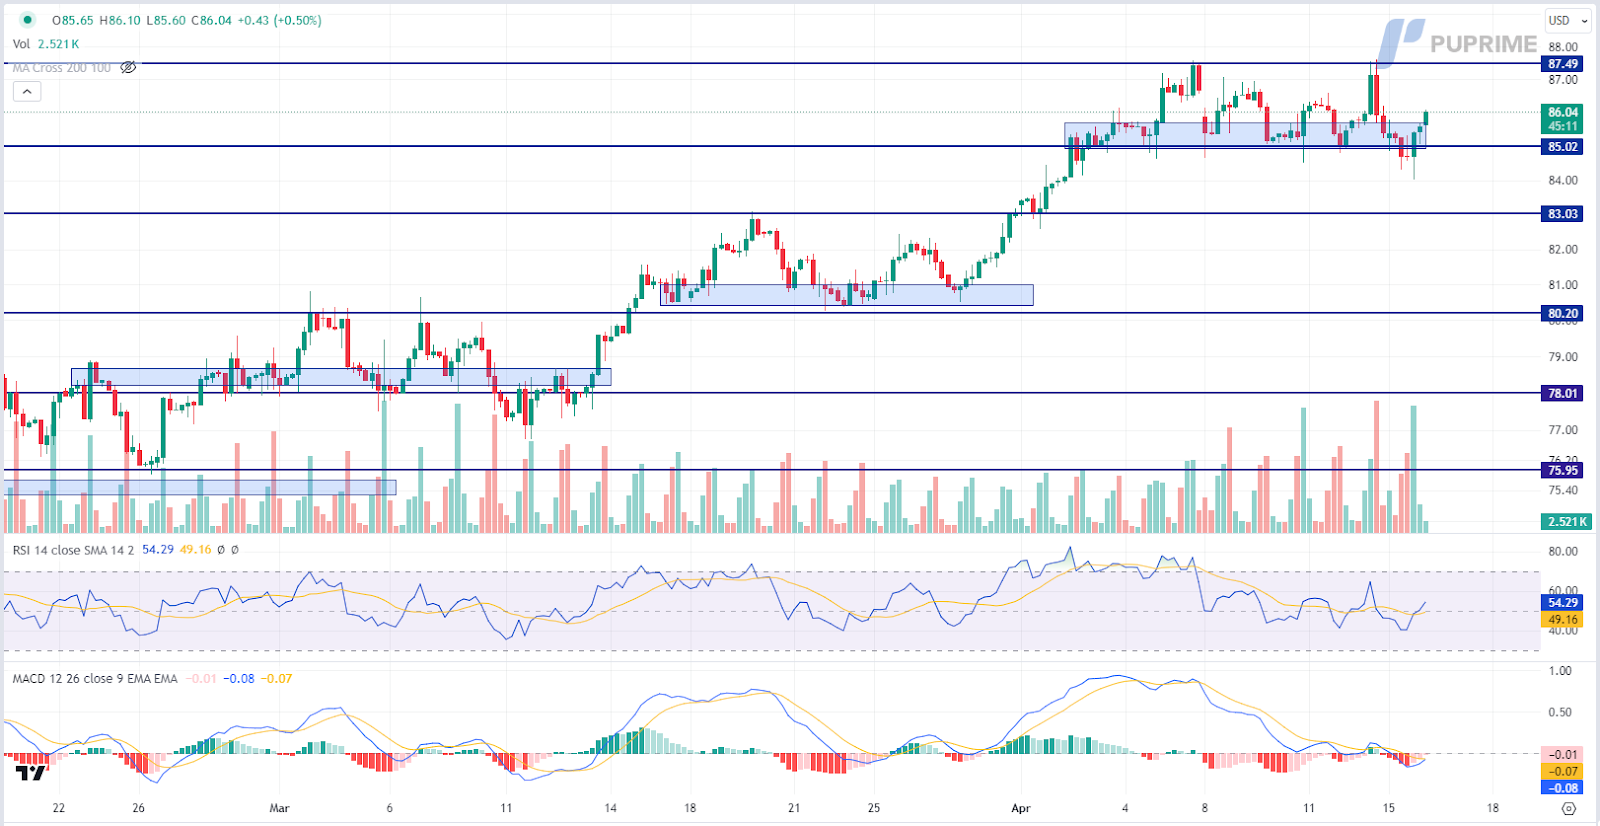
CL OIL, H4
Oil prices rebounded from support levels, supported by rising geopolitical tensions and fears of supply disruptions. Concerns persist following Iran’s recent attack on Israel, fueling apprehensions of potential retaliatory actions and disruptions in oil supply. Additionally, speculation about tighter oil sanctions on Iran by the United States further contributed to market uncertainty. Investors closely monitor geopolitical developments for trading cues amidst ongoing tensions in the Russia-Ukraine conflict.
Oil prices are trading higher following the prior rebound from the support level. MACD has illustrated diminishing bearish momentum, while RSI is at 54, suggesting the commodity might extend its gains since the RSI stays above the midline.
Resistance level: 87.50, 90.90
Support level: 85.00, 83.05
Inizia a Fare Trading con un Vantaggio
Scambia forex, indici, Metalli e altro ancora a spread bassi e con un'esecuzione fulminea.
Inizia a fare trading con depositi a partire da $50 sui nostri conti standard.
Ottieni accesso all’assistenza 24/7
Accedi a centinaia di strumenti, a strumenti didattici gratuiti e ad alcune delle migliori promozioni in circolazione.
Please note the Website is intended for individuals residing in jurisdictions where accessing the Website is permitted by law.
Please note that PU Prime and its affiliated entities are neither established nor operating in your home jurisdiction.
By clicking the "Acknowledge" button, you confirm that you are entering this website solely based on your initiative and not as a result of any specific marketing outreach. You wish to obtain information from this website which is provided on reverse solicitation in accordance with the laws of your home jurisdiction.
Ten en cuenta que el sitio web está destinado a personas que residen en jurisdicciones donde el acceso al sitio web está permitido por la ley.
Ten en cuenta que PU Prime y sus entidades afiliadas no están establecidas ni operan en tu jurisdicción de origen.
Al hacer clic en el botón "Aceptar", confirmas que estás ingresando a este sitio web por tu propia iniciativa y no como resultado de ningún esfuerzo de marketing específico. Deseas obtener información de este sitio web que se proporciona mediante solicitud inversa de acuerdo con las leyes de tu jurisdicción de origen.