I pattern dei grafici svolgono un ruolo fondamentale nell'analisi tecnica, offrendo ai trader un quadro visivo per identificare i potenziali cambiamenti di momentum del mercato. Tra i numerosi pattern seguiti dagli analisti, il triangolo ascendente è particolarmente degno di nota perché indica una probabile continuazione delle tendenze rialziste. Tuttavia, nonostante la sua solida reputazione, il pattern non sempre si comporta come ci si aspetta. Quando i breakout non si materializzano o si invertono rapidamente, i trader si trovano di fronte a un problema di modello di triangolo ascendente fallito. Questo è uno scenario che può avere importanti implicazioni per la futura azione dei prezzi.
Comprendere le dinamiche dei triangoli ascendenti, sia quelli riusciti che quelli falliti, è essenziale per i trader che vogliono navigare nella complessità dei mercati finanziari odierni. Riconoscendo questi schemi e le loro variazioni, i trader possono prendere decisioni informate, gestire il rischio in modo efficace e adattare le loro strategie a condizioni mutevoli.
Che cos'è un modello di triangolo ascendente?
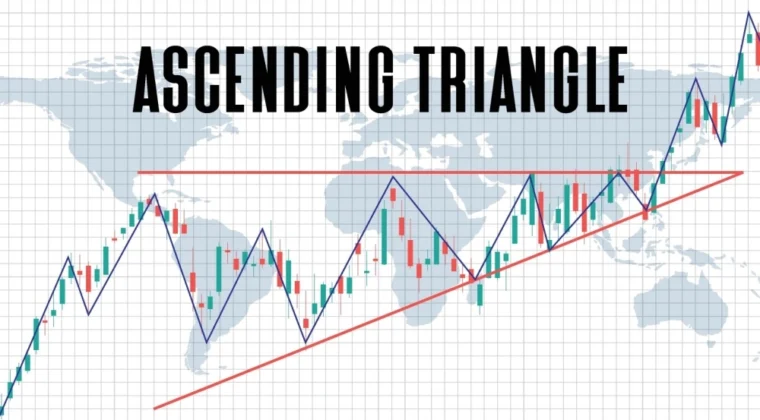
Un triangolo ascendente è una formazione grafica comunemente riconosciuta nell'analisi tecnica che di solito indica una continuazione rialzista. Si forma quando l'azione dei prezzi di un mercato crea una linea di resistenza orizzontale in alto e un linea di tendenza ascendente sotto. Ogni volta che i prezzi si avvicinano al limite superiore, lottano per rompere più in alto ma si ritirano verso un minimo più alto creando la caratteristica linea di supporto ascendente.
Formazione tipica
- Resistenza orizzontale: Una serie di massimi simili o quasi uguali forma un limite superiore piatto. Questo livello rappresenta spesso un'area chiave in cui i venditori entrano nel mercato.
- Linea di supporto ascendente: I minimi crescenti sotto la linea di resistenza rivelano una pressione d'acquisto in arrivo a prezzi progressivamente più alti.
- Convergenza: Quando la distanza tra supporto e resistenza si riduce, il mercato raggiunge un punto di tensione in cui è più probabile che si verifichi un breakout.
Importanza nel prevedere le tendenze rialziste
I triangoli ascendenti sono classificati come pattern di continuazione. In un trend rialzista consolidato, il pattern spesso segnala strong upside momentum if price eventually closes above the horizontal resistance on higher-than-usual volume. Traders watch for this breakout, interpreting it as a sign that buyers have overcome the selling pressure at the resistance line.However, like all technical patterns, ascending triangles are not foolproof. A seemingly perfect formation can result in a failed ascending triangle pattern if price fails to break above resistance or if the breakout lacks follow-through.
Cosa provoca il fallimento di un triangolo ascendente?
Despite the ascending triangle’s reputation as a reliable continuation pattern, it can still break down in unexpected ways. In a failed ascending triangle pattern, the anticipated bullish breakout never fully materialises, or if it does, it quickly reverses. Several factors can contribute to this scenario:
- Weak Volume
A genuine breakout from an ascending triangle is often confirmed by an increase in trading volume. If volume remains low, it may signal insufficient buying pressure to overcome the resistance level. Even when price breaches the upper boundary, the move can fizzle out and revert below resistance due to a lack of enthusiastic participation from traders.
- Shifts in Market Sentiment
Market psychology plays a significant role in the success or failure of chart patterns. If broader sentiment suddenly turns negative buyers may lose conviction. This erosion in bullish sentiment prevents the follow-through needed for a sustained breakout.
- External Factors and News Events
Unexpected macroeconomic announcements, geopolitical tensions, or industry-specific news can rapidly alter trading conditions. These developments sometimes overshadow technical patterns, causing reversals or accelerating selling pressure at key resistance levels.
- Overextension or Exhaustion
If the underlying asset has already rallied significantly, buyers could become wary of overpaying. This caution can dampen the momentum typically required for an ascending triangle to break decisively upwards. As a result, the pattern may stall or collapse, leading to a failed breakout.
By recognising these triggers, traders can better prepare for potential downside scenarios.
Approfondimenti psicologici dietro i modelli di triangolo ascendente
Il ascending triangle pattern is more than just a technical formation on a chart—it represents a battle between buyers and sellers and reveals important clues about market psychology.
Gli acquirenti acquistano fiducia
As the price forms minimi più alti, it reflects increasing confidence among buyers. Each time the price pulls back, buyers are willing to step in earlier, believing the asset is undervalued at progressively higher levels.
This behaviour creates the upward-sloping trendline that underpins the ascending triangle, signalling growing demand and optimism.
Venditori che tengono la linea
Il linea di resistenza orizzontale shows that sellers remain active at a specific price level, preventing the market from breaking higher. This resistance often represents a psychological barrier, such as a prior high, where many traders anticipate a reversal.
Sellers’ resolve can weaken over time if buying pressure intensifies, leading to the eventual breakout.
Il punto di svolta
As the pattern progresses, the space between the resistance line and the rising trendline narrows, creating tension. This reflects a build-up of momentum as buyers and sellers prepare for a decisive move.
The final breakout (or breakdown) is often explosive, as one side dominates and the price reacts accordingly.
Fattori emotivi nei fallimenti
When an ascending triangle fails, it often indicates a shift in sentiment. Buyers may lose confidence due to external factors like negative news or weak volume, causing the pattern to collapse.
Conversely, sellers may reassert control if the resistance level is perceived as too strong, leading to a breakdown instead of a breakout.
Come identificare il modello del triangolo ascendente
Spotting an ascending triangle on a price chart requires careful observation of both horizontal resistance e rising support.
-
Pinpoint a Flat Resistance Line
- Look for repeated highs at roughly the same price level. These highs do not need to be identical, but they should cluster within a small price range.
- Mark this line on your chart; it represents a resistance zone where selling pressure tends to emerge.
-
Check for Higher Lows (Ascending Trendline)
- Observe the price swings below the resistance line. If you can connect these troughs with a rising trendline, you have the beginning of an ascending triangle.
- This ascending support should be tested at least twice, indicating that buyers are stepping in at progressively higher levels.
-
Confirm Convergence
- As trading continues, the horizontal resistance line and ascending trendline should gradually narrow, creating the recognisable triangle shape.
- The point where these two lines meet is known as the “apex”. Price typically breaks out—upwards or downwards—before reaching the apex.
-
Watch Volume and Momentum Indicators
- Volume often declines during the consolidation phase within the triangle, then spikes if a breakout occurs.
- Tools like moving averages and relative strength index (RSI) can help gauge whether momentum supports a breakout scenario.
Esempio del mondo reale
Imagine a major commodity such as gold trading near a long-term resistance level of £1,900 per ounce. Over several weeks, gold’s price fails to surpass this threshold, creating a horizontal line of resistance. Meanwhile, the low points of each consolidation are forming ever-higher troughs—£1,850, then £1,870, and so on—indicating increasing buying interest. Charting these higher lows reveals a rising support line, producing a classic ascending triangle formation.
Using trading programs, it is possible to track historical price data and overlay technical indicators to confirm whether volume and momentum align with a potential breakout. By identifying these key elements, traders gain better insight into the likelihood of a sustained bullish move.
Come identificare un modello di triangolo ascendente fallito
A failed ascending triangle occurs when the anticipated bullish breakout either does not materialise or quickly reverses course. Recognising the tell-tale signs of a failure is crucial for traders aiming to avoid unnecessary losses and adapt their strategies promptly.
- Breakout Rejection Near Resistance
- After drawing your horizontal resistance line, watch for repeated attempts to breach that level.
- If the price frequently tests the resistance but is met with strong selling pressure each time (causing a pullback below the ascending support line) this is an early indicator that the pattern may not hold.
- False Breakout With Low Volume
- Even if the price does move briefly above the resistance, check the trading volume.
- A convincing breakout usually features a surge in volume. When volume remains thin, it implies limited buying enthusiasm. The price may then drift back into or below the triangle, signalling a failed pattern.
- Sharp Drop Below the Rising Support Line
- In a classic ascending triangle, the rising trendline underpins each pullback.
- If the price penetrates the lower trendline with a decisive candlestick close (especially on high volume) it indicates that sellers have gained the upper hand, negating the bullish structure.
- Return to the Breakout Zone
- Another clue is when price action breaks out momentarily but quickly returns to the breakout zone or even drops beneath it.
- This whipsaw motion often reveals a lack of commitment from buyers and points to a high risk of continued downside pressure.
Esempio del mondo reale
Consider a forex pair like GBP/USD forming an ascending triangle with a horizontal resistance around 1.3100. After several failed attempts to close above 1.3100, the pair briefly rallies to 1.3120 on lacklustre volume. Soon after, it plummets back below 1.3100 and breaches its rising trendline around 1.3050. The move is accompanied by a surge in selling volume, confirming a failed ascending triangle.
Using a platform like PU Prime, traders can overlay volume indicators and use real-time price alerts to spot such false breakouts in progress. By identifying the abrupt drop below the support line or the rapid return under resistance, traders gain a strong signal that the previously bullish scenario is no longer valid.
Implicazioni di un triangolo ascendente fallito
When an ascending triangle fails, the consequences for market sentiment and price direction can be significant. Rather than continuing to trend higher, the failed breakout or sudden breakdown often signals a shift in control from buyers to sellers.
- Potential Bearish Reversal
- A strong push below the rising support trendline indicates that sellers have overpowered buying pressure.
- This reversal can quickly gain momentum, prompting traders to adjust positions or adopt short-selling strategies.
- Prolonged Consolidation
- Sometimes, a failed ascending triangle does not immediately result in a steep decline. Instead, price may move sideways, reflecting uncertainty among market participants.
- Prolonged consolidation can keep traders on the sidelines until a clearer direction emerges.
- Erosion of Bullish Sentiment
- A pattern’s failure can undermine trader confidence. When a widely recognised bullish setup falls apart, it often leads to increased caution and potentially reduced participation, further limiting upside potential.
- Reassessment of Technical Indicators
- Once the triangle fails, volume, moving averages, or oscillators like the Relative Strength Index (RSI) may shift to reflect new market conditions.
- Traders may re-evaluate stop-loss placements or exit strategies to manage the heightened risk.
Piattaforme di trading e strumenti analitici
Utilising comprehensive platforms, such as those offered by PU Prime, allows traders to quickly recognise a shift in momentum. By setting price alerts, monitoring real-time volume data, and using customisable charting tools, traders can better interpret whether a failed ascending triangle is likely to lead to a full-fledged downtrend or a drawn-out consolidation phase.
Strategie di trading per entrambi i modelli
Even though ascending triangles are often seen as bullish continuation patterns, it is important to have strategies in place for both successful e failed breakouts.
Trading su un triangolo ascendente di successo
- Anticipate the Breakout
Monitor the market as the price action approaches the apex of the triangle. Look for a significant rise in volume during any breakout attempt above the horizontal resistance.
- Enter on Confirmation
Wait for a clear candlestick close above the resistance line (ideally on higher-than-usual volume) before opening a long position. This approach helps avoid whipsaws.
- Impostare gli ordini di stop-loss
Place your stop loss just below the last swing low or slightly beneath the rising trendline. This helps limit potential losses if the breakout proves false.
- Use a Price Target
Measure the height of the triangle and project it upwards from the breakout point to estimate a realistic profit target.
Trading su un triangolo ascendente fallito
- Spot Signs of Weakness
Pay close attention to decreasing volume or repeated failures at the resistance line. This is an early indication that momentum may be fading.
- Short on Breakdown
If the price decisively breaches the rising support line, a short position could be considered. Waiting for a solid close below support helps reduce the risk of a false breakdown.
- Adjust Stop Loss
For short trades, place your stop loss above the pattern’s apex or just beyond the horizontal resistance line. This positioning allows you to exit quickly if sellers fail to maintain control.
- Watch for Consolidation
A failed breakout does not always translate to a strong downtrend. If price action becomes choppy, consider using tighter stops or waiting for further confirmation before committing capital.
Gestire il rischio e le emozioni
Regardless of whether the ascending triangle meets or defies expectations, risk management is paramount. Tools that offer stop-loss settings, advanced charting features, and real-time volume data allow traders to monitor the market more effectively. Focus on keeping a clear head and well-defined rules for entering and exiting trades. This is especially the case in volatile conditions where sentiment can flip rapidly.
Limitazioni del trading dei modelli di triangolo ascendente
While ascending triangles can provide valuable insights, relying on this single chart pattern carries inherent risks. A comprehensive trading approach requires awareness of the potential pitfalls:
- False evasioni
- One of the main drawbacks of all chart patterns, including ascending triangles, is the possibility of false or failed breakouts. Traders who enter prematurely may be stopped out if the price reverses direction unexpectedly.
- Confirming a breakout with additional indicators (such as volume surges or momentum oscillators) helps reduce the chances of being caught in a whipsaw.
- Dependence on Market Conditions
- Ascending triangles often hinge on stable or bullish market sentiment for an upside move. Dramatic shifts in economic data, corporate news, or geopolitical events can invalidate a pattern overnight, regardless of how well-formed it appears.
- It is crucial to track broader market conditions and remain flexible in your expectations.
- Over-Reliance on a Single Pattern
- Technical analysis involves a myriad of tools, from moving averages to momentum studies. Focusing exclusively on an ascending triangle may blind traders to other crucial signals.
- Combining multiple forms of technical analysis and, in some cases, fundamental research helps provide a fuller picture before committing to a trade.
- Subjectivity in Drawing Lines
- Chart patterns can be somewhat subjective. Two traders might draw slightly different trendlines, leading to disagreements on whether the pattern is valid.
- Consistency is key: establish a reliable method for drawing support and resistance lines, and stick to it to reduce misinterpretation.
- Timeframe Sensitivity
- Ascending triangles can appear on a variety of timeframes, from intraday 5-minute charts to weekly charts. However, a pattern visible on a shorter timeframe might carry less weight than one established over a longer period.
- Adapting your strategy to the specific timeframe is crucial, especially when using CFDs that can magnify both gains and losses.
Indicatori complementari
Traders can benefit from advanced charting tools to cross-verify potential breakout scenarios. Features like multiple chart overlays and technical studies help confirm whether an ascending triangle aligns with broader market signals. By combining various indicators and carefully managing your position size, you can guard against the inherent limitations of relying on a single pattern.
Applicazioni in tutti i mercati
Ascending triangle patterns, including their failed variations, occur in multiple asset classes. Their core principles (horizontal resistance, rising support, and the potential for a breakout) apply whether you’re trading forex, stock indices, commodities, or other instruments.
Forex
- Volatile Currency Pairs: In the foreign exchange market, pairs like GBP/USD or EUR/JPY can exhibit an ascending triangle when economic factors or central bank policies drive repeated tests of a resistance zone.
- Failure Risks: A sudden shift in sentiment (due to interest rate announcements or political news) can undermine a previously reliable triangle setup, causing price to retreat rapidly below support.
Indici azionari
- Equity Benchmarks: Major indices such as the S&P 500 can form ascending triangles during bullish phases. Traders interpret multiple upward swings as increased confidence in the broader equity market.
- Failed Patterns: If risk sentiment deteriorates (due to weak corporate earnings or global instability) an ascending triangle on an index chart may fail, indicating a move back down to key support levels or prolonged sideways trading.
Materie prime
- Gold, Silver, and Crude Oil: Commodity prices are influenced by supply-demand imbalances, geopolitical tensions, and macroeconomic data (e.g. inflation rates). An ascending triangle may form when demand is consistently pushing the price upward against a known resistance.
- Bearish Turns: If demand unexpectedly weakens or producers boost supply, the pattern may fail, resulting in a quicker downward correction and signalling a temporary peak in commodity prices.
CFD azionari
- Individual Stocks: Shares of large-cap companies often display discernible price patterns when trading volume is high and liquidity is abundant. An ascending triangle can precede a bullish breakout, but disappointing earnings releases or changes in sector outlook can derail the pattern.
- Shorting Failed Patterns: When a failed ascending triangle occurs, speculative traders who trade share CFDs may consider short positions if momentum turns sharply bearish.
Trading con PU Prime
Because PU Prime enables the trading of CFD across a range of global markets (forex, indices, commodities, and shares) the ascending triangle pattern (and its potential failure) can be applied consistently. With real-time data, customisable chart overlays, and advanced analytical tools, traders can adapt swiftly to changing market conditions. By focusing on volume trends and key news events, you can better gauge whether a triangle is likely to succeed or fail, regardless of the underlying asset.
Whether you’re analysing a currency pair’s response to economic reports or monitoring index fluctuations, the versatility of ascending triangle patterns remains a valuable aspect of any chart-based trading strategy. However, as always, it is important to combine multiple indicators and maintain prudent risk management to mitigate the effect of false or failed breakouts.
Padroneggiare i modelli di triangolo ascendente
Il triangolo ascendente is a powerful tool in a trader’s arsenal, but even the most reliable patterns can fail. Understanding its formation, recognising the signs of a failed breakout, and adapting your strategy accordingly are essential skills for navigating the complexities of financial markets.
Suggerimenti per i trader
- Confirm Breakouts with Volume: Ensure the breakout is supported by a surge in volume to reduce the risk of false signals.
- Impostare gli ordini di stop-loss: Always place a stop loss outside the pattern to protect against unexpected reversals.
- Monitor Market Conditions: External events and market sentiment can greatly impact the reliability of technical patterns.
- Use Multiple Indicators: Combine the ascending triangle with tools like RSI, moving averages, or Bollinger Bands for better confirmation.
- Practise with Demo Accounts: Test strategies without financial risk to refine your approach before trading live.
Ready to refine your trading skills? Explore PU Prime’s advanced charting tools with a conto demo to practise identifying ascending triangles and their variations.
Domande frequenti
Cosa indica un triangolo ascendente fallito?
A failed ascending triangle typically signals a shift in market sentiment. Instead of breaking above the resistance level, the price reverses and breaks below the rising support line, often leading to a bearish reversal or extended consolidation. This failure suggests that buyers lost momentum, and sellers regained control.
Come reagiscono i trader ai pattern falliti?
Traders often adjust their strategies when a pattern fails. For example, they may initiate short positions if the price breaks below the ascending support line or wait for new patterns to emerge before committing capital. The key is to monitor volume and momentum indicators to confirm the breakdown and avoid trading on false signals.
Un triangolo ascendente fallito può riprendersi?
Yes, it’s possible for a failed pattern to recover if market conditions improve or new buying pressure emerges. However, traders should wait for clear confirmation of a bullish breakout before re-entering a long position.
Come posso ridurre il rischio di trading di pattern falliti?
To minimise risk, always confirm breakouts or breakdowns with volume and use ordini di stop-loss to cap potential losses. Additionally, combining ascending triangle analysis with complementary indicators like RSI or MACD can provide more reliable signals.
I triangoli ascendenti sono solo modelli rialzisti?
No, while ascending triangles are often associated with bullish trends, they can also appear in bearish markets as a reversal pattern. The direction of the breakout (up or down) depends on the prevailing trend and market conditions.