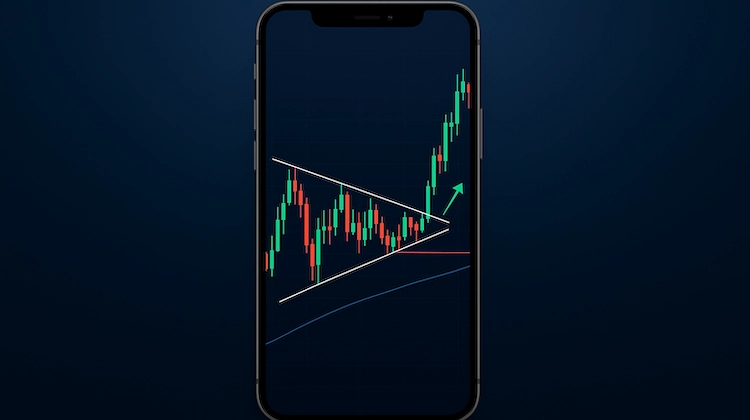
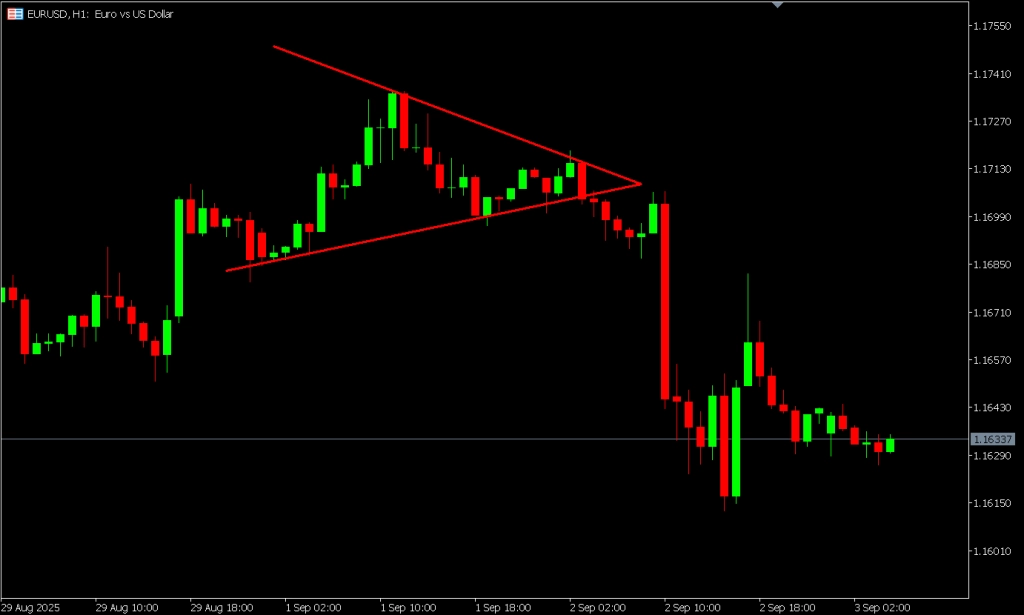
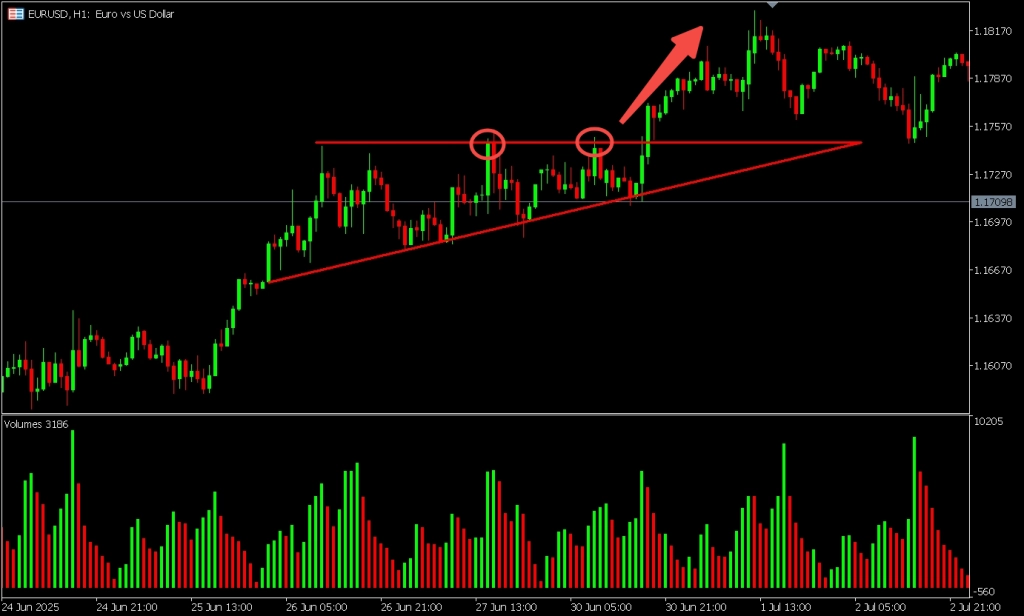
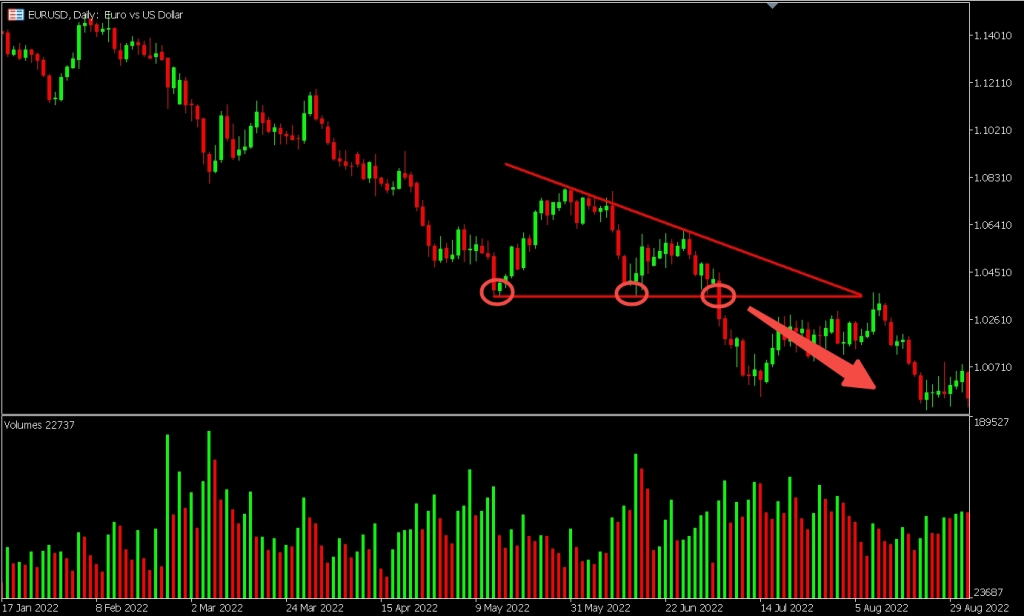
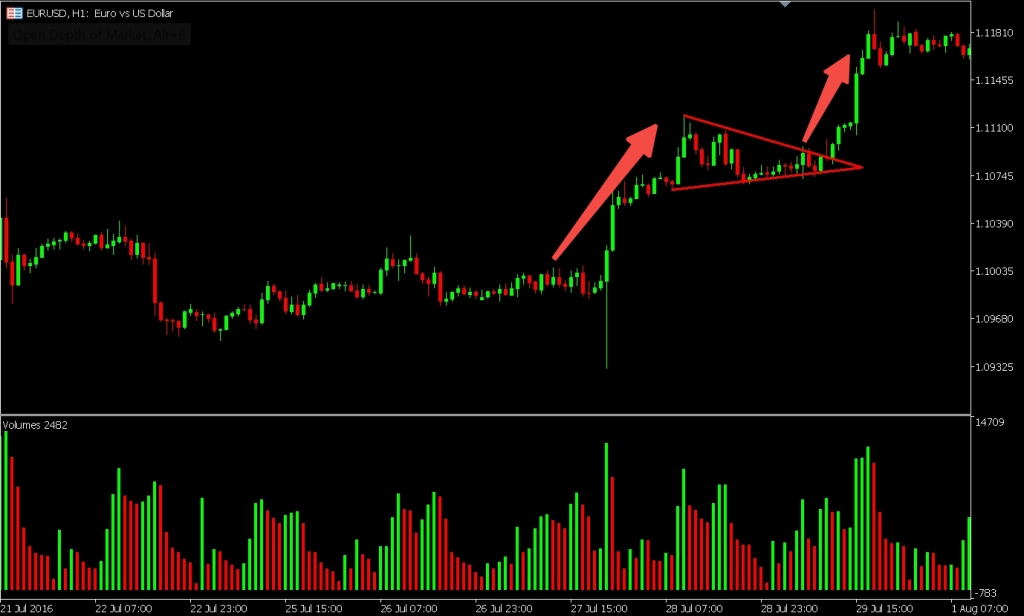
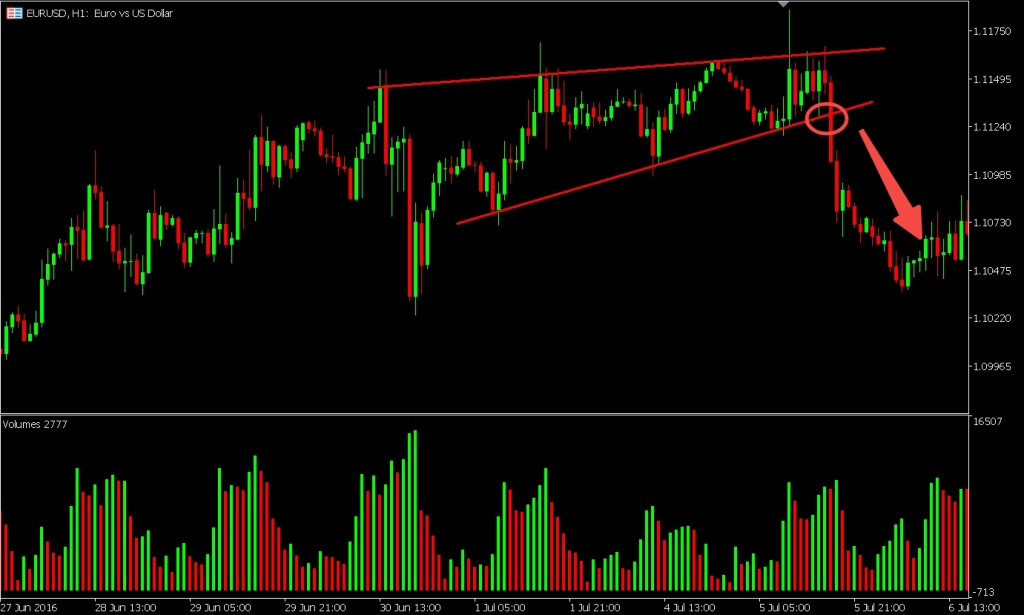
The symmetrical triangle pattern is a neutral chart formation that signals a period of market consolidation, often leading to a breakout. It forms between two converging trendlines (one connecting lower highs, the other connecting higher lows) as buying and selling pressure reach temporary equilibrium.
Traders use this pattern to anticipate potential breakout opportunities. While direction is not guaranteed, breakouts often align with the prior trend and are typically confirmed by increased volume. Risk management strategies include waiting for candle closes outside the pattern, setting logical stop-loss levels, and projecting price targets based on the pattern’s height.
Symmetrical triangles can appear across a wide range of markets, including forex, indices, commodities, and metals. With proper confirmation and discipline, this pattern can support a broader technical analysis strategy.
In technical analysis, the symmetrical triangle pattern is a popular chart formation that signals a period of market consolidation. It forms when two trendlines converge: one descending, connecting a series of lower highs, and one ascending, connecting a series of higher lows. As the price moves between these boundaries, it creates a triangle shape that gradually narrows toward a point known as the apex.
This pattern reflects a temporary balance between buying and selling pressure. Neither side is in control, which leads to smaller price swings over time. As the triangle progresses, the trading range tightens and volatility decreases. This compression often precedes a breakout, where price moves sharply above or below the triangle as momentum returns to the market.
The symmetrical triangle is commonly viewed as a neutral pattern. It does not inherently indicate direction until a confirmed breakout occurs. Traders typically monitor this setup closely, as it can signal the continuation of the previous trend or, in some cases, a potential reversal depending on the broader market context.
The Psychology Behind the Symmetrical Triangle Pattern
A Temporary Balance Between Buyers and Sellers
The symmetrical triangle pattern signals a period of consolidation where market forces are evenly matched. As prices narrow within converging trendlines, neither buyers nor sellers have enough strength to trigger a decisive trend. This stand-off reflects uncertainty, as market participants wait for more information before committing.
What Lower Highs and Higher Lows Really Mean
Each lower high indicates buyers are becoming more cautious, unable to push prices above previous peaks. At the same time, higher lows show sellers are struggling to push prices down. This pattern of compressed momentum suggests that both sides are repositioning before a larger move.
Why Market Tension Builds Inside the Triangle
As the pattern develops, price action becomes tighter and trading volume typically decreases. Traders hesitate to enter new positions while waiting for a breakout. This shrinking activity represents stored energy, which often results in a sharp move once price escapes the pattern.
The Breakout as a Shift in Market Sentiment
When the breakout happens, it typically signals that one side has gained control. If the breakout is to the upside, it suggests that bullish sentiment has returned. If the move is downward, bearish momentum may be taking over. In both cases, volume tends to rise sharply as participation increases. *chartschool.stockcharts.com
Punti di forza
The symmetrical triangle reflects a temporary equilibrium between buyers and sellers. Lower highs and higher lows show reduced momentum on both sides. Volume often contracts within the pattern, then expands on breakout. A confirmed breakout suggests a shift in sentiment and market direction.
How to Identify a Symmetrical Triangle on a Chart
Start by Confirming a Prior Trend
Symmetrical triangles typically form during periods of trend continuation. The most reliable patterns occur after a clear uptrend or downtrend. This existing trend sets the context for the consolidation that follows, helping traders interpret the potential breakout direction more effectively.
Draw the Converging Trendlines
To identify the pattern, draw two trendlines that gradually move toward each other:
Il upper trendline connects a series of lower highs.
Il lower trendline connects a series of higher lows.
As the price compresses within this narrowing range, it forms a symmetrical triangle, with the trendlines pointing to a shared center point called the apex.
Use Touchpoints to Validate the Pattern
For a symmetrical triangle to be considered valid, each trendline should have at least two confirmed touchpoints. These touches reflect repeated interaction with support and resistance, which helps validate the pattern’s strength. In some cases, a third touchpoint can add further confirmation.
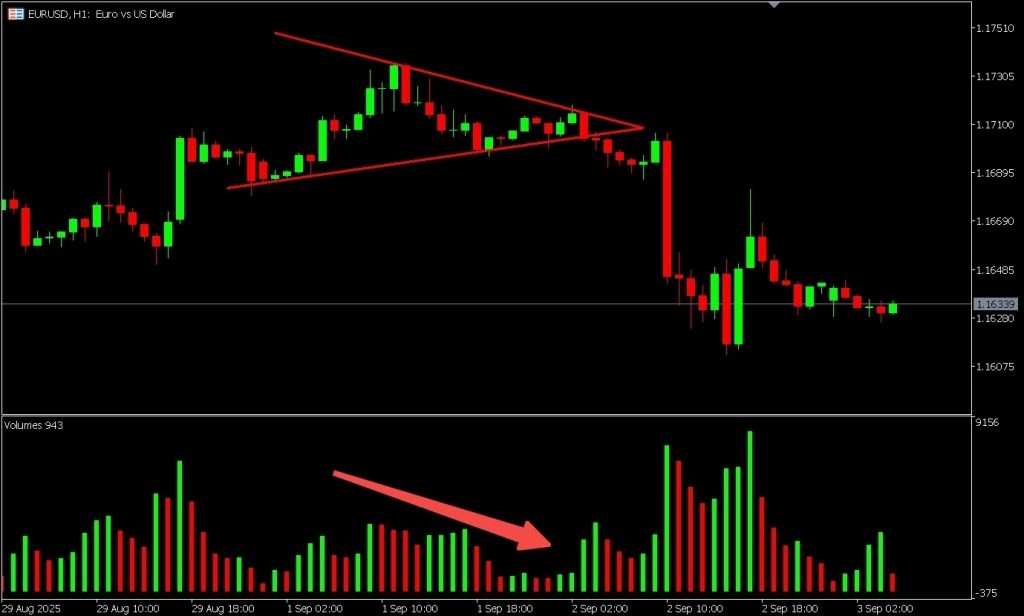
Pay Attention to Volume
Volume typically decreases as the pattern forms. This reduction in activity reflects indecision in the market, where traders await a clear breakout before re-entering positions. A sudden spike in volume near the breakout point often helps confirm the move.
Choose Your Timeframe
Symmetrical triangle patterns can form over various timeframes, from a few hours to several weeks. While the trading principles remain the same, traders should adjust their risk and position size according to their usual trading timeframe.
Quick Triangle Pattern Identification Checklist
Caratteristica
Descrizione
Prior Trend
Should follow an uptrend or downtrend
Upper Trendline
Slopes downward, connecting lower highs
Lower Trendline
Slopes upward, connecting higher lows
Touchpoints Required
Minimum of two on each trendline
Pattern Shape
Triangle formed by converging support and resistance
Volume Behavior
Declines during pattern formation, often rises on breakout
Timeframes
Seen on intraday, daily, or weekly charts
Breakout Timing
Typically occurs between halfway and three-quarters of the distance to the apex
Begin by confirming a prior trend before identifying the triangle. A valid pattern includes two or more lower highs and higher lows forming converging trendlines. Volume typically contracts during formation and expands on breakout. Symmetrical triangles can appear across timeframes, from short-term to long-term charts.
Symmetrical Triangle vs Other Chart Patterns
Understanding how symmetrical triangles differ from similar chart patterns can help traders avoid misidentifying setups. While many patterns share visual characteristics, each has unique implications for price movement, trend direction, and breakout behavior. This section compares symmetrical triangles to ascending triangles, descending triangles, pennants, and wedges.
Symmetrical Triangle
Structure: Two trendlines, one descending (lower highs), one ascending (higher lows), converging toward an apex.
Bias: Neutral. Direction is unknown until a confirmed breakout occurs.
Volume: Typically decreases during formation, then expands on breakout.
Breakout: Can move in either direction depending on market conditions.
Ascending Triangle
Structure: Flat upper resistance line and rising lower support line.
Bias: Bullish. Buyers are consistently testing resistance, indicating potential for upward breakout.
Breakout: Typically breaks higher, especially in an existing uptrend.
Descending Triangle
Structure: Flat lower support line and falling upper resistance line.
Bias: Bearish. Sellers are pushing prices down, testing support repeatedly.
Breakout: Often breaks lower, especially during a downtrend.
Pennant
Structure: Small symmetrical triangle forming after a strong price move (flagpole).
Bias: Continuation. Direction is typically in line with the initial move.
Tempistica: Shorter duration than full triangle patterns.
Wedge (Falling or Rising)
Structure: Both trendlines slope in the same direction (up or down), converging toward the apex.
Bias: Can signal reversal or continuation depending on the broader trend.
Breakout: Opposite the direction of the wedge.
Visual Comparison Table
Pattern
Structure
Bias
Common Breakout Direction
Symmetrical Triangle
Converging highs and lows
Neutral
Either, depends on breakout
Ascending Triangle
Flat top, rising bottom
Bullish
Upward
Descending Triangle
Flat bottom, falling top
Bearish
Downward
Pennant
Mini triangle after sharp move
Continuation
In direction of previous move
Rising Wedge
Both lines slope up
Bearish
Downward (usually reversal)
Falling Wedge
Both lines slope down
Bullish
Upward (usually reversal)
Punti di forza
Symmetrical triangles are neutral, while ascending and descending triangles carry directional bias. Pennants resemble small symmetrical triangles but occur after strong price moves. Wedges differ by having both trendlines sloping in the same direction and often signal reversals. Accurate identification helps avoid misinterpreting market signals and improves decision-making.
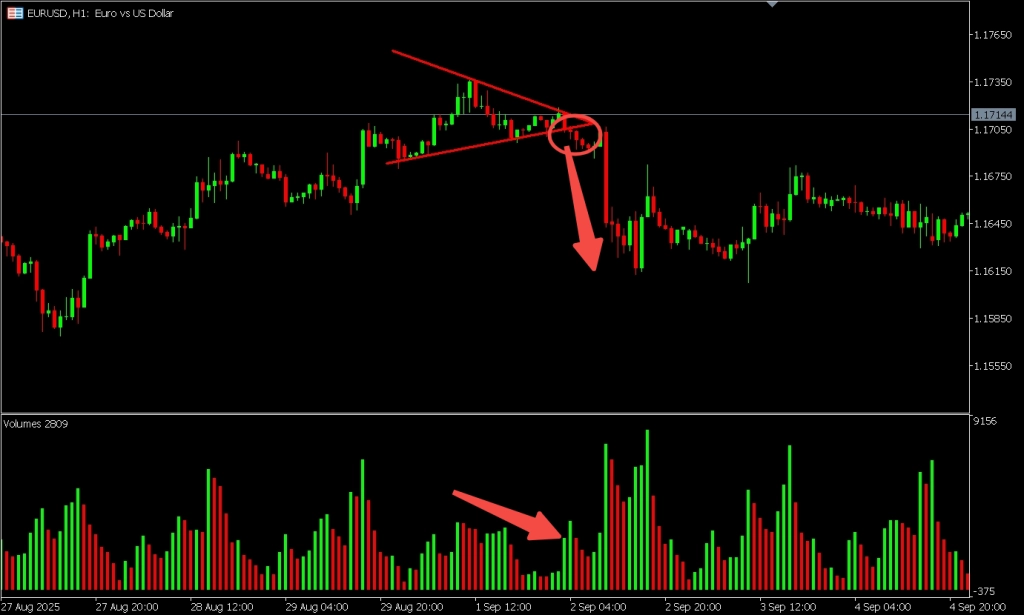
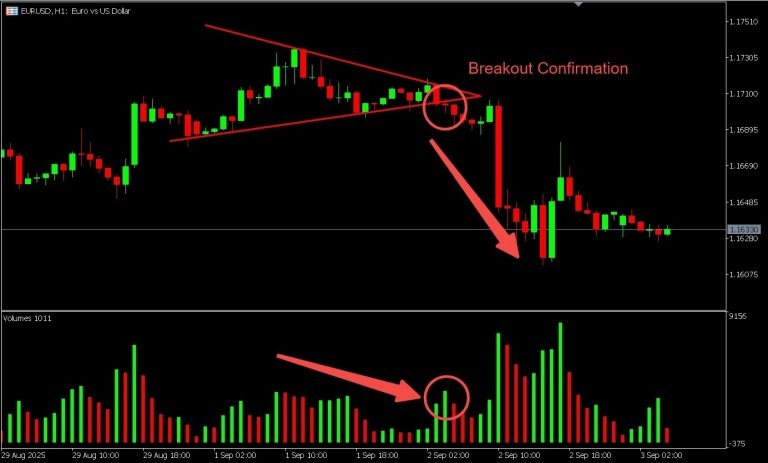
Breakout Confirmation and Direction
Once a symmetrical triangle pattern nears completion, attention turns to the breakout. Since the pattern reflects market indecision, the breakout is where direction is finally revealed. Confirming this move with clear price action and supporting volume helps reduce the risk of false signals.
What Signals a Breakout Is Approaching?
As price moves closer to the triangle’s apex, the trading range tightens significantly. This reduced volatility often precedes a breakout. Traders may notice:
Smaller candlestick bodies and wicks
Lower trading volume
Price hugging the upper or lower trendline
The Role of Volume in Breakout Confirmation
Trading volume is a critical element in confirming symmetrical triangle breakouts. During the pattern’s formation, volume tends to decline, reflecting hesitation. A sharp rise in volume at the breakout point indicates increased conviction among market participants and can help validate the move.
What Confirms a Valid Breakout?
A breakout is generally considered valid when:
The price closes clearly outside the triangle’s boundaries
The breakout candle shows strong direction and momentum
Volume is significantly higher than during the consolidation phase
Traders typically wait for these signals before treating the breakout as confirmed.
Can the Breakout Direction Be Predicted?
While symmetrical triangles are neutral by design, they frequently act as continuation patterns, meaning the breakout moves in the direction of the prior trend. However, breakouts can also signal reversals, especially in changing market conditions. For this reason, the direction should always be confirmed with price and volume, rather than assumed based on trend alone.
Punti di forza
A breakout often occurs before the price reaches the triangle’s apex. Volume typically decreases during pattern formation and rises at the breakout. A confirmed breakout includes a strong close beyond the trendline with supporting volume. While continuation breakouts are common, reversals are possible, so confirmation is essential.
Common Trading Techniques Using Symmetrical Triangle Patterns
Symmetrical triangle patterns are frequently used by traders as part of a broader technical analysis strategy. While the pattern itself does not predict direction, it helps highlight moments of consolidation and potential breakout. Once the breakout is confirmed, many traders use well-established methods to manage entries, exits, and risk.
Typical Entry Points After Breakout
A common technique is to enter a trade after the price closes outside the triangle in the breakout direction. This helps filter out minor price movements that don’t represent genuine momentum.
Some traders prefer to wait for a retest of the broken trendline. This occurs when the price breaks out, pulls back to the trendline, and then continues in the breakout direction. A successful retest can provide an additional layer of confirmation. *The Pattern Site
Setting Price Targets Based on the Pattern
The most widely used method for estimating price targets is the height projection technique:*Investopedia
Measure the vertical distance between the highest and lowest point of the triangle.
Project that distance from the breakout point in the direction of the move.
This provides a logical estimate of how far price may travel following a valid breakout.
Where Traders Commonly Place Stop-Loss Orders
Effective risk management is a key part of any trading strategy. With symmetrical triangles, stop-loss orders are often placed:
Just inside the triangle, on the opposite side of the breakout.
Below the most recent swing low (for upside breakouts) or above the swing high (for downside breakouts).
This approach helps limit risk in case the breakout fails and price returns inside the pattern.
Trading Symmetrical Triangles on PU Prime
PU Prime clients can encounter symmetrical triangle patterns across various CFDs, including forex pairs, indices, commodities, and metals. Platforms like MetaTrader 4 (MT4), MetaTrader 5 (MT5), and the PU Prime App support advanced charting and drawing tools that make it easier to identify and react to these patterns.
While symmetrical triangles can provide useful trade setups, it’s important to remember that CFD trading involves speculation on price movements and carries risk. Clients do not own the underlying assets and should always apply sound risk management.
Punti di forza
Entry points may be based on breakout confirmation or a retest of the trendline. Price targets are often calculated using the height of the triangle projected from the breakout. Stop-loss orders are typically placed just inside the triangle or at a recent swing level. PU Prime platforms support charting tools that help identify symmetrical triangle setups across multiple markets.
Avoiding False Breakouts and Mistakes
Symmetrical triangle patterns can present valuable trading opportunities, but they also carry risks—particularly when breakouts are not confirmed properly. False breakouts, where price temporarily moves outside the triangle before reversing, can lead to poor entries and unexpected losses. Recognizing common pitfalls and applying disciplined trading habits can help reduce exposure to these outcomes.
What Is a False Breakout?
A false breakout occurs when the price breaks through one side of the triangle but then fails to continue in that direction, quickly reversing back into the pattern. This can happen when volume is weak or when traders anticipate a breakout too early.
False breakouts often trap traders who enter without proper confirmation, leading to premature positions and increased drawdown risk.
Errori comuni da evitare
Avoiding these frequent missteps can improve pattern reliability:
Entering Before Confirmation: Acting on a breakout before a clear candle close and volume increase often results in exposure to false moves.
Ignoring Volume: Low-volume breakouts are less trustworthy. Without strong participation, a move may lack the momentum to continue.
Misplacing Stop-Loss Orders: Stops placed too close to the trendline may get triggered by minor volatility before the breakout fully develops.
Chasing Price: Jumping into a breakout after it’s already extended can lead to poor risk-reward and difficult trade management.
How Traders Manage These Risks
While no setup is foolproof, traders often take the following steps to reduce the likelihood of losses:
Wait for confirmation: A strong candle close beyond the trendline and a clear volume spike.
Use alerts: Many trading platforms, including PU Prime’s MT5 and app, allow traders to set alerts when price approaches key levels.*Set Alerts – PU Prime Help Center
Follow a plan: Setting predefined entry, exit, and stop levels based on the pattern’s structure helps maintain consistency.
Avoid overleveraging: Using excessive leverage increases risk, especially in volatile breakout scenarios.
Punti di forza
False breakouts can occur when price moves beyond the triangle without strong confirmation. Common mistakes include early entries, neglecting volume, and stop-loss placement errors. Risk can be reduced by waiting for breakout confirmation, following a clear trading plan, and managing position size carefully. PU Prime’s trading platforms offer tools to monitor patterns and set alerts for breakout zones.
Applying the Symmetrical Triangle Pattern
The symmetrical triangle pattern highlights market indecision and potential breakout setups. While direction is not guaranteed, confirmed breakouts can offer valuable trading opportunities when combined with volume analysis and risk management.
On platforms like MetaTrader 4, MetaTrader 5, and the PU Prime App, traders can draw trendlines, track volume, and set alerts to monitor pattern development in real time. PU Prime offers access to CFDs across forex, indices, metals, and commodities — all markets where these patterns may appear.
Suggerimenti per i trader
Confirm with volume: Breakouts are more reliable when accompanied by a noticeable rise in volume.
Set alerts: Use platform tools to monitor when price approaches the trendlines or apex.
Avoid chasing breakouts: Wait for a full candle close outside the triangle before acting.
Measure targets carefully: Use the height of the triangle to estimate potential price moves.
Keep risk in check: Place stop-loss orders at logical levels to protect your position.
Ready to chart your strategy? Open a PU Prime account and explore advanced charting tools across forex, indices, commodities, and more.
Domande frequenti (FAQ)
Is a symmetrical triangle pattern bullish or bearish?
The symmetrical triangle is considered a neutral pattern. It reflects market consolidation and does not suggest a direction until a breakout occurs. While it often acts as a continuation pattern, breakouts can move either upward or downward depending on broader market conditions.
How reliable is the symmetrical triangle pattern?
Its reliability depends on context. Patterns that form during strong trends and break out with high volume are generally more dependable. Like all technical tools, the symmetrical triangle should be used alongside other indicators and analysis techniques.
Can this pattern predict the size of a price move?
Yes. A common technique is to measure the vertical height of the triangle at its widest point and project that distance from the breakout level. This offers a general estimate of how far the price may move following a breakout.
What technical indicators work well with symmetrical triangles?
Momentum and volume indicators can provide additional confirmation. Popular tools include:
MACD: To assess momentum shift during or after the breakout
RSI: To detect potential overbought or oversold conditions
Volume: To validate the strength of the breakout
What happens if price breaks out but then reverses?
This is known as a false breakout. It can occur when volume is weak or if traders act too early. Managing this risk involves waiting for a confirmed close outside the pattern and placing stop-loss orders at sensible levels.
Can symmetrical triangles form in any market?
Yes. They can appear in forex, indices, commodities, metals, and shares. PU Prime’s CFD offerings span all these asset classes, making it possible to identify symmetrical triangle patterns across a wide range of instruments.
How long do symmetrical triangle patterns usually last?
The duration varies depending on the timeframe and market. On short-term charts, the pattern may form over a few hours or days. On longer-term charts, it may take several weeks to complete.
Inizia a Fare Trading con un Vantaggio
Scambia forex, indici, metalli e altro ancora a spread bassi e con un'esecuzione fulminea.
Inizia a fare trading con depositi a partire da $50 sui nostri conti standard.
Ottieni accesso all'assistenza 24/7
Accedi a centinaia di strumenti, a strumenti didattici gratuiti e ad alcune delle migliori promozioni in circolazione.
Il Sito è destinato a persone residenti in giurisdizioni in cui l'accesso al Sito è consentito dalla legge.
Si prega di notare che PU Prime e le sue entità affiliate non hanno sede né operano nella giurisdizione del vostro paese.
Facendo clic sul pulsante "Riconosci", l'utente conferma di essere entrato in questo sito web esclusivamente su sua iniziativa e non come risultato di una specifica attività di marketing. Desiderate ottenere informazioni da questo sito web che sono fornite su sollecitazione inversa in conformità con le leggi della vostra giurisdizione.
Tenete presente che il sito web è destinato a persone che risiedono in giurisdizioni in cui l'accesso al sito web è consentito dalla legge.
Tieni presente che PU Prime e le sue entità affiliate non sono stabilite né operano nella tua giurisdizione di origine.
Facendo clic sul pulsante "Accetta", si conferma che si sta accedendo a questo sito web per iniziativa propria e non come risultato di alcuno sforzo di marketing specifico. Desideri ottenere informazioni da questo sito web che ti vengono fornite tramite una richiesta inversa in conformità con le leggi della tua giurisdizione di origine.