U.S. equity markets saw upward momentum, driven by a rally in tech stocks.
The U.S. dollar maintained a sideways trajectory as market participants awaited more cues from the U.S. Personal Consumption Expenditures (PCE) data that is due on Friday. Investors are keenly observing developments that could provide insights into the upcoming monetary policy stance of the Federal Reserve. Meanwhile, U.S. equity markets saw upward momentum, driven by a rally in tech stocks. Japan’s Nikkei also continued its upward trend, reaching record highs, fueled by expectations of a dovish stance in the upcoming Bank of Japan (BoJ) interest rate decision. In the oil market, prices surged to their highest levels in 2024 due to heightened tension in the Red Sea. Fresh strikes by the U.S. and the UK against the Houthis added to geopolitical concerns, impacting oil markets. Meanwhile, in the cryptocurrency market, Bitcoin (BTC) witnessed a decline of approximately 20% since the approval of the BTC ETF weeks ago. Currently trading below the psychological support level of $40,000, BTC faces challenges as market dynamics continue to evolve.
Current rate hike bets on 31 January Fed interest rate decision:
Source: CME Fedwatch Tool
0 bps (98%) VS -25 bps (2%)
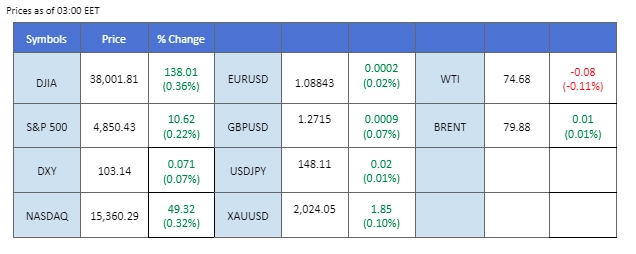
Market Overview
Economic Calendar
(MT4 System Time)
N/A
Source: MQL5
Market Movements
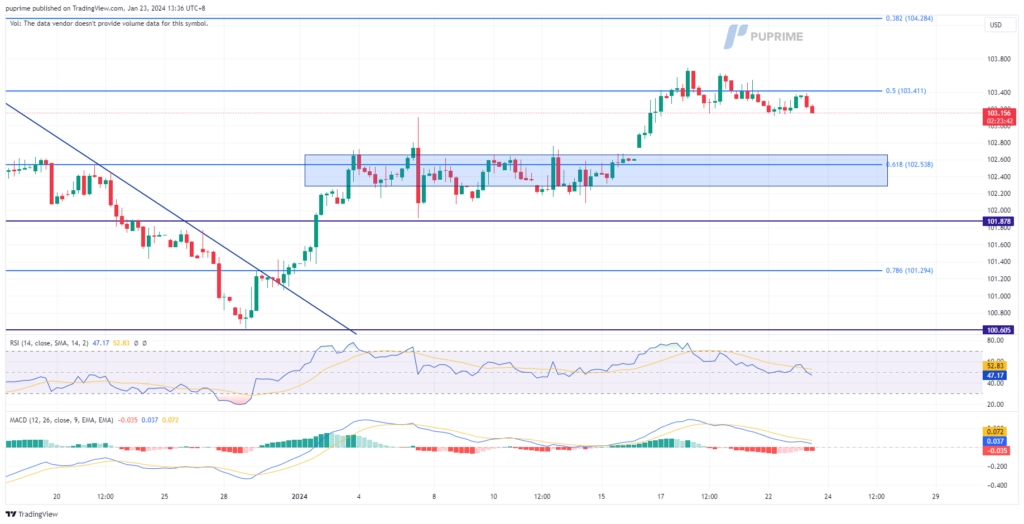
DOLLAR_INDX, H4
The Dollar index displayed a muted performance against major currencies, as investors closely monitored upcoming monetary policy decisions from pivotal central banks, notably the Bank of Japan and European Central Bank. Despite this cautious stance, the Dollar maintained a bullish trend, emerging as the top performer among developed market currencies last week. Upbeat economic data reinforced the Dollar’s strength, prompting a reassessment of expectations for rate cuts as March approaches.
The Dollar Index is trading higher while currently testing the resistance level. MACD has illustrated diminishing bearish momentum, while RSI is at 57, suggesting the index might extend its gains after breakout since the RSI stays above the midline.
Resistance level: 103.40, 104.30
Support level: 102.55, 101.90
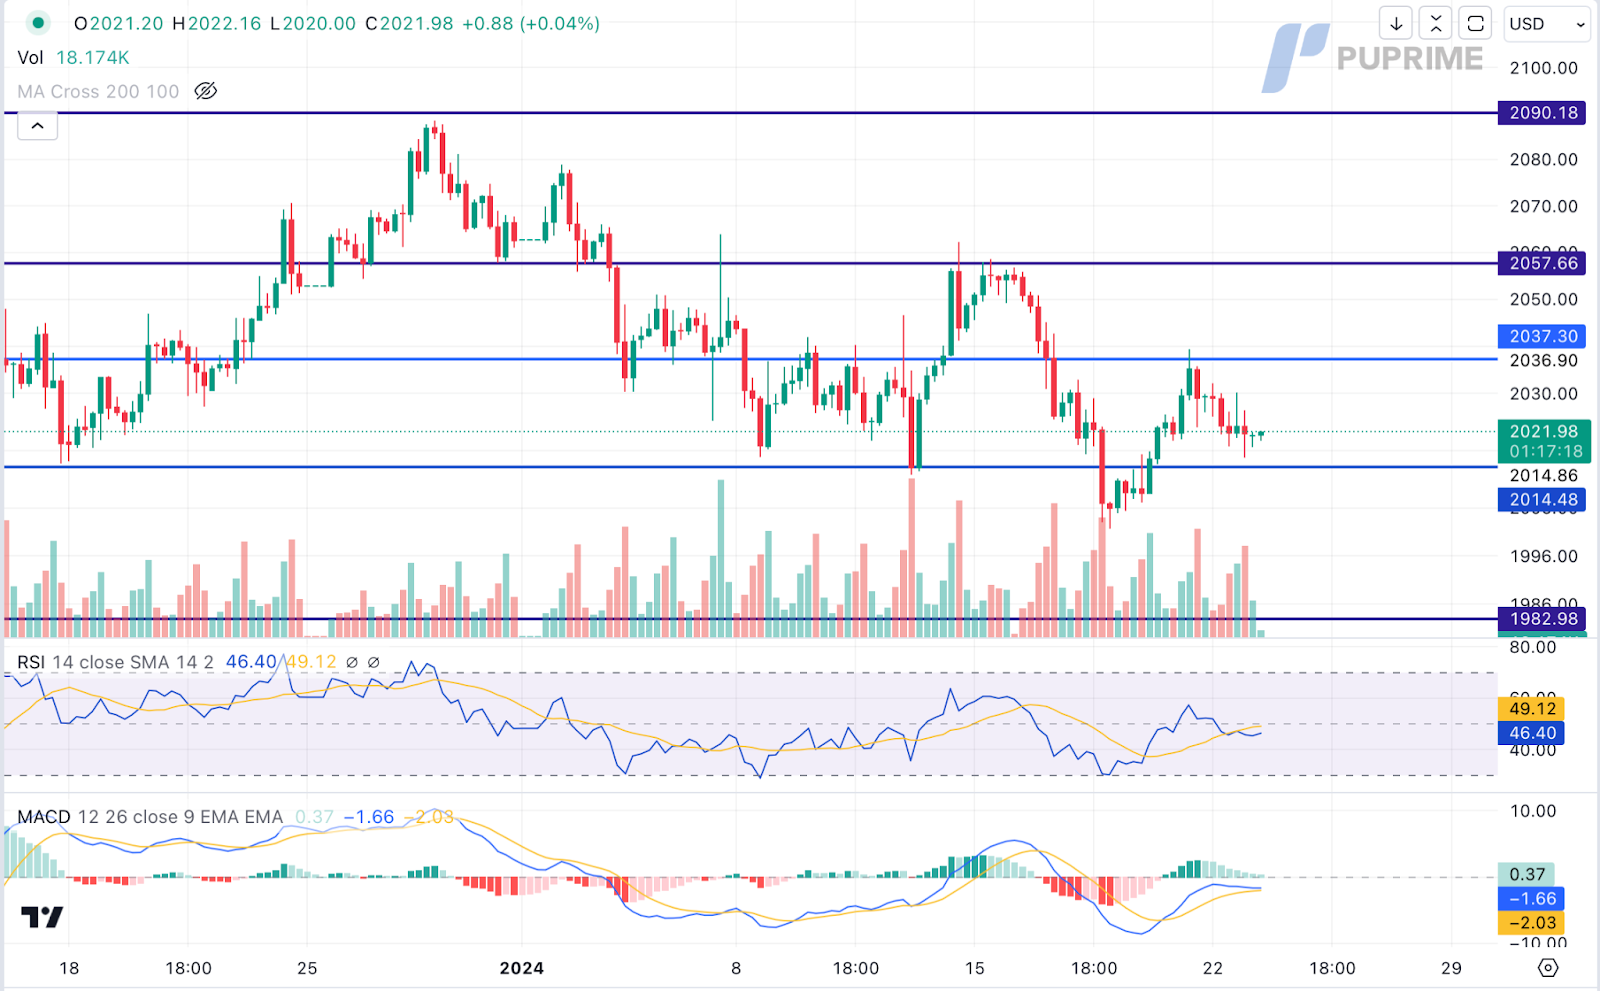
XAU/USD, H4
Gold prices faced downward pressure as investors increasingly bet on the Federal Reserve maintaining higher interest rates. Despite safe-haven demand preventing a dip below the psychologically significant $2,000 level, the retreat was evident. The CME FedWatch Tool’s indication of reduced probabilities for a rate cut in March aligns with Fed officials’ statements emphasising the need for further observation of the U.S. economic performance.
Gold prices are trading lower following the prior retracement from the resistance level. MACD has illustrated diminishing bullish momentum, while RSI is at 46, suggesting the commodity might extend its losses toward support level since the RSI stays below the midline.
Resistance level: 2035.00, 2055.00
Support level: 2015.00, 1985.00
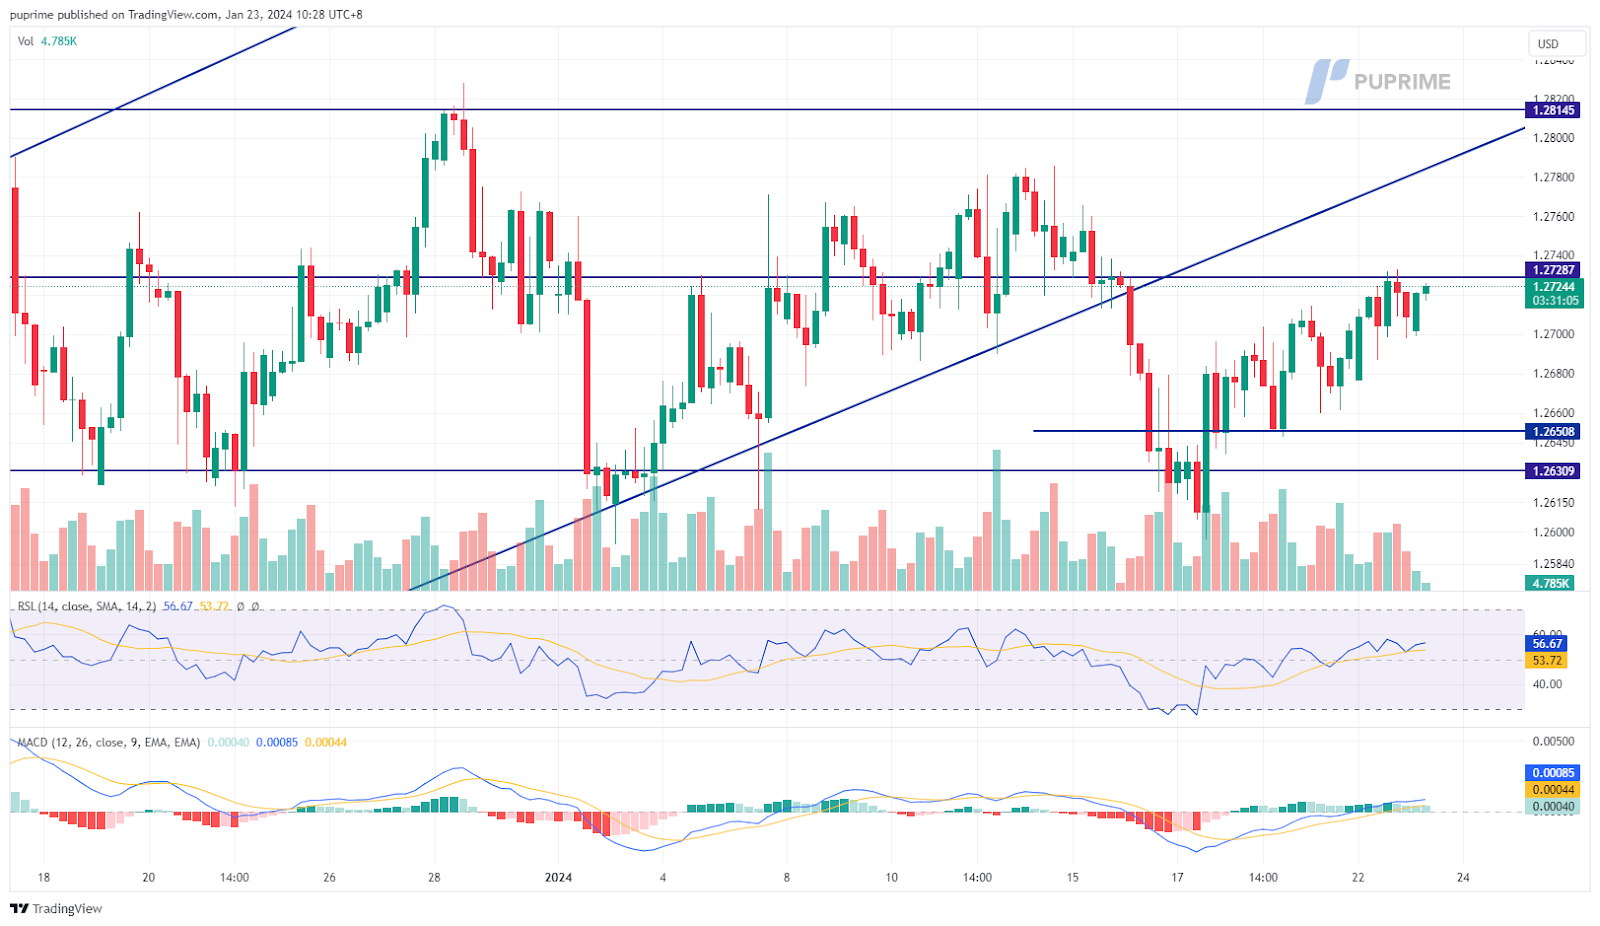
GBP/USD,H4
The Pound Sterling remains trading bullish, but the momentum has eased as the pair approaches the resistance level at 1.2729. The U.S. dollar experienced muted trading, contributing to the positive momentum for the Pound Sterling. Investors eagerly await the upcoming U.S. Purchasing Managers’ Index (PMI) reading and the highly anticipated U.S. Personal Consumption Expenditures (PCE) data scheduled for release later this week.
The GBP/USD pair is currently facing a strong resistance level at 1.2729; a break above such a level suggests the pair is trading in a strong bullish momentum. The RSI continues to move upward while the MACD has broken above the zero line, suggesting the pair continue to trade with bullish momentum.
Resistance level: 1.2729, 1.2815
Support level: 1.2630, 1.2528
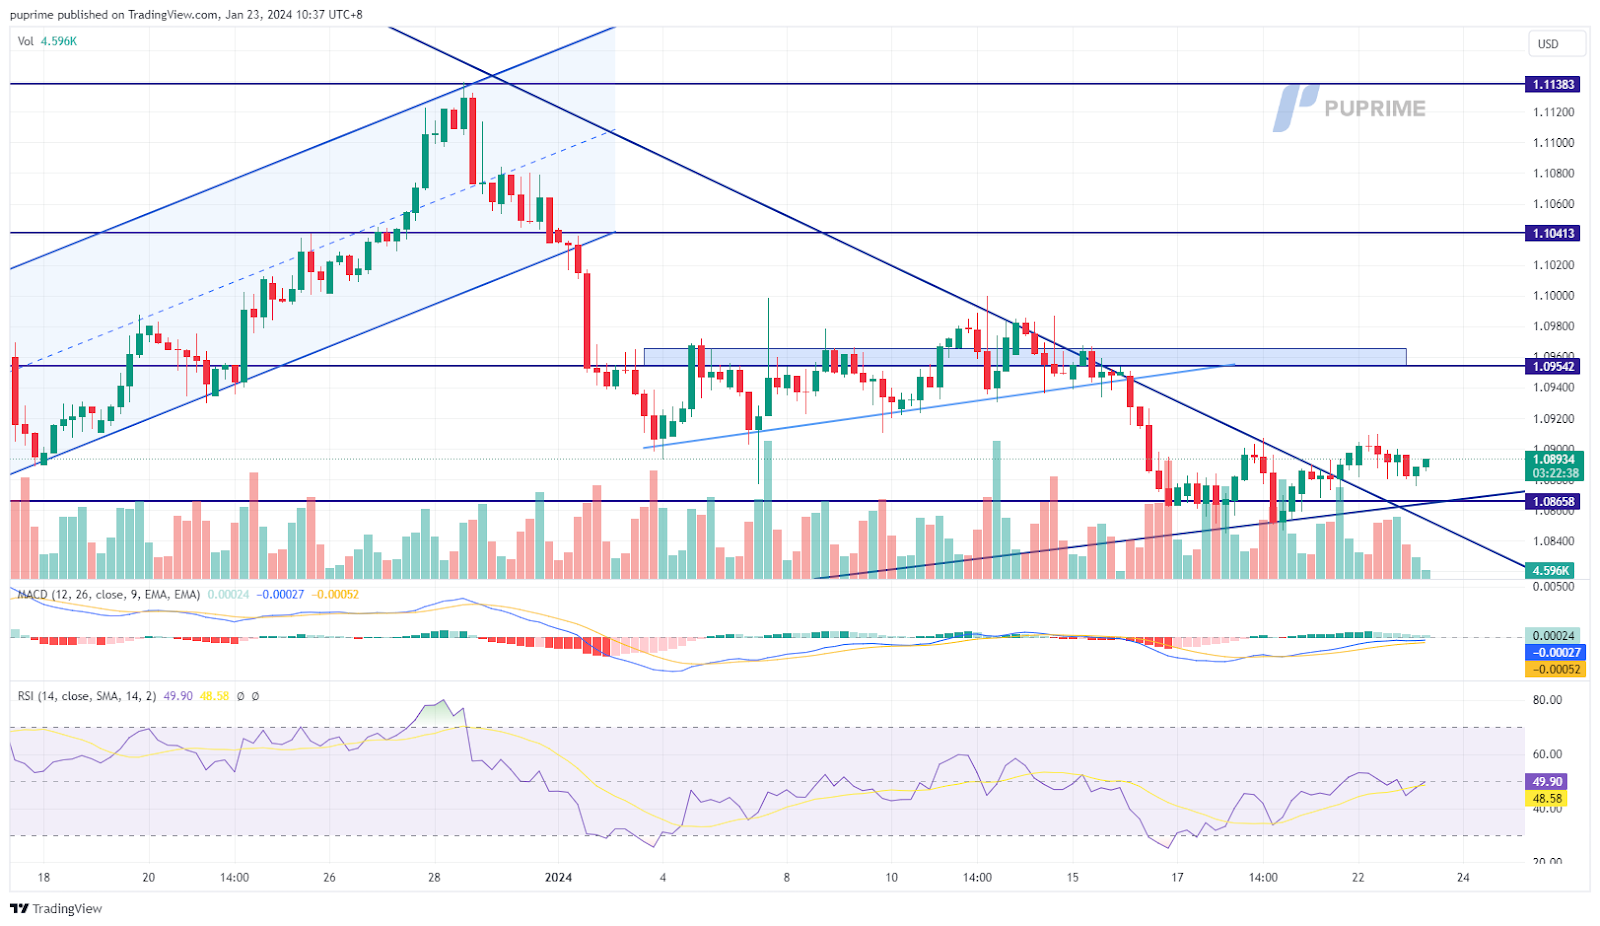
EUR/USD,H4
The EUR/USD pair navigated a sideways trajectory in anticipation of the upcoming European Central Bank (ECB) interest rate decision scheduled for Thursday. Analysts suggest that lacklustre economic data and a softening Consumer Price Index (CPI) reading have set the stage for expectations that the ECB will likely maintain its current interest rate level. Market sentiment points toward a cautious approach, with projections indicating that the ECB may initiate rate cuts in the second quarter of 2024.
The EUR/USD pair remains trading in a sideways manner and is given a neutral signal for the pair. The RSI is flowing flat near the 50-level while the MACD hovers along with the zero line, and both indicators are also given a neutral signal.
Resistance level: 1.0954, 1.1041
Support level: 1.0866, 1.0775
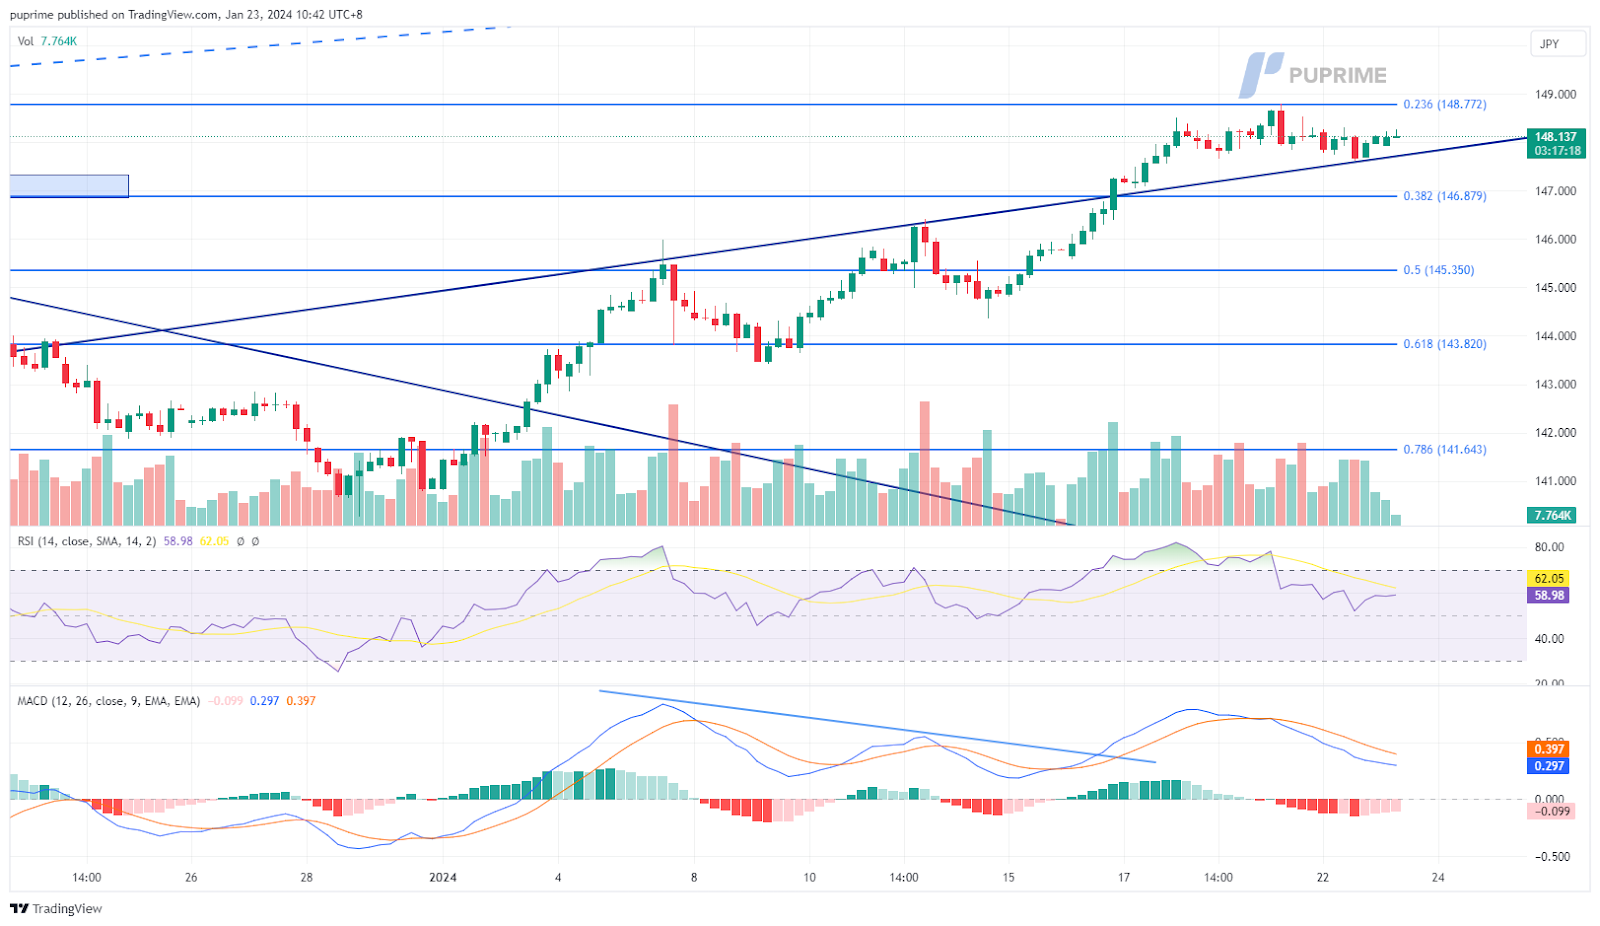
USD/JPY,H4
The USD/JPY pair continued to exhibit a sideways trend, consolidating near its monthly highs as traders eagerly awaited the Bank of Japan’s (BoJ) impending interest rate decision. Market expectations lean towards the BoJ maintaining its current monetary policy measures, influencing the Japanese Yen to trade with weakness against its counterparts.
USD/JPY traded sideways at its elevated level ahead of the crucial event. The RSI has dropped out of the overbought zone while the MACD has crossed on the above, suggesting the bullish momentum has drastically eased.
Resistance level: 148.88, 151.83
Support level: 146.90 145.35
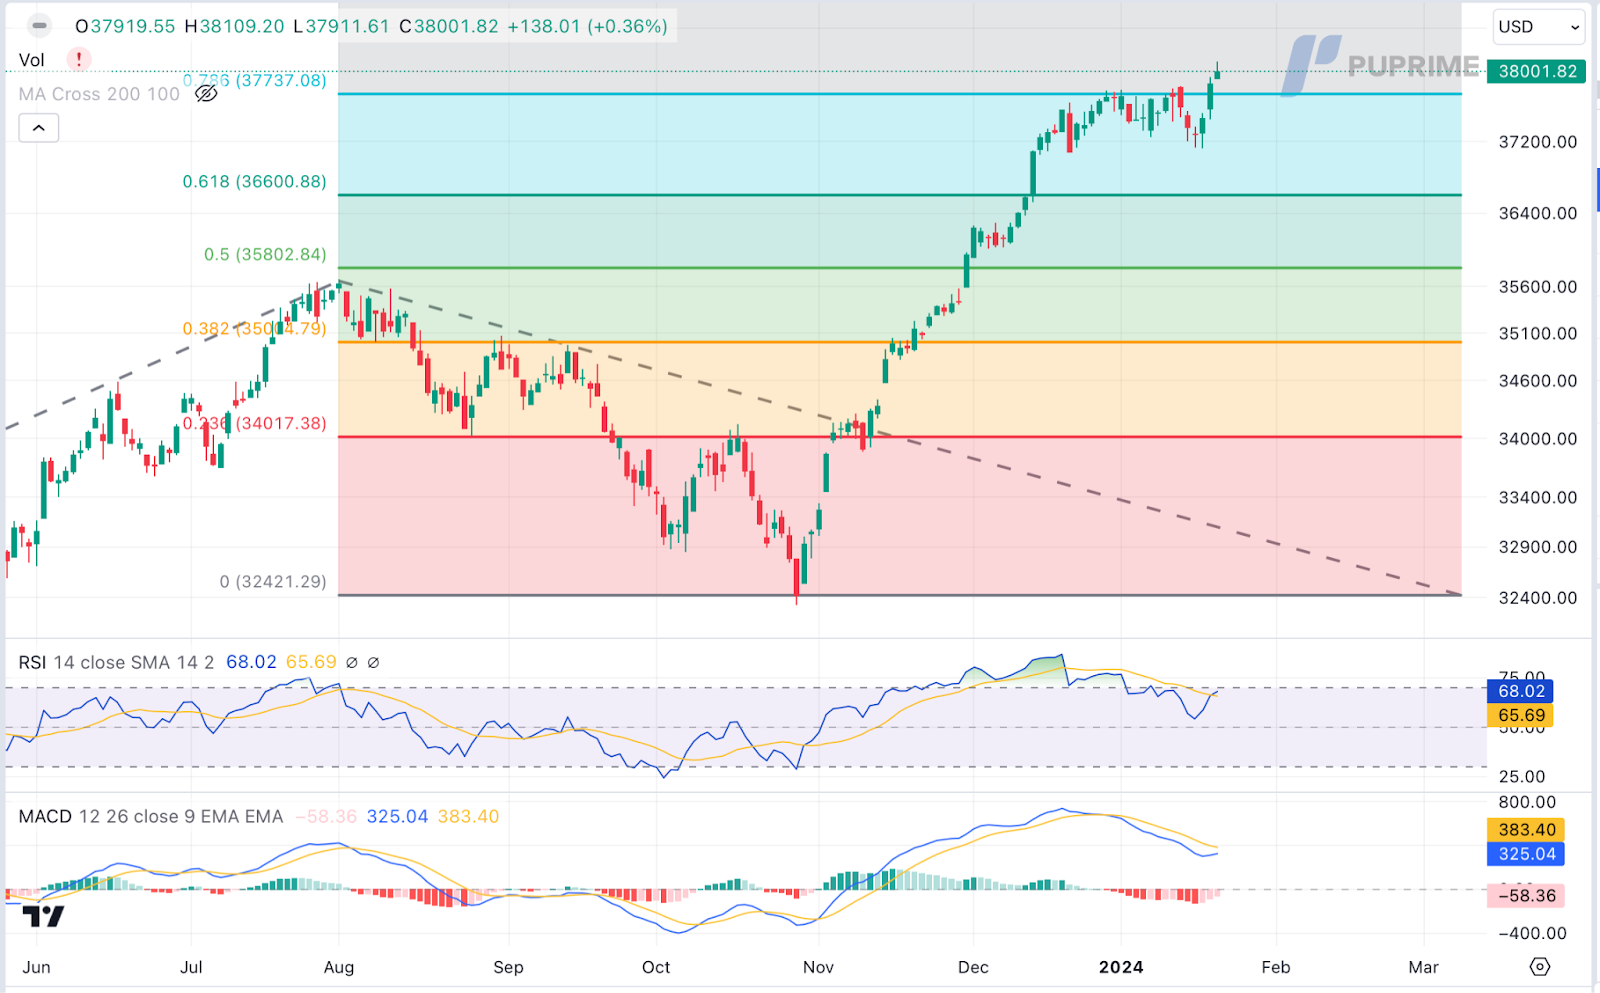
Dow Jones, Daily
The U.S. equity market sustained its upward momentum, propelled by a series of better-than-expected financial results. Goldman Sachs’ prediction of global hedge funds shifting portfolios towards U.S. technology stocks further fueled optimism. The active accumulation of positions in the tech sector reflects renewed confidence in Artificial Intelligence (AI) and a positive outlook for major global tech entities, contributing to the ongoing appeal of the U.S. equity market.
The Dow is trading higher following the prior breakout above the previous resistance level. MACD has illustrated diminishing bearish momentum, while RSI is at 68, suggesting the index might extend its gains since the RSI stays above the midline.
Resistance level: 39000.00, 40000.00
Support level: 37850.00, 36600.00
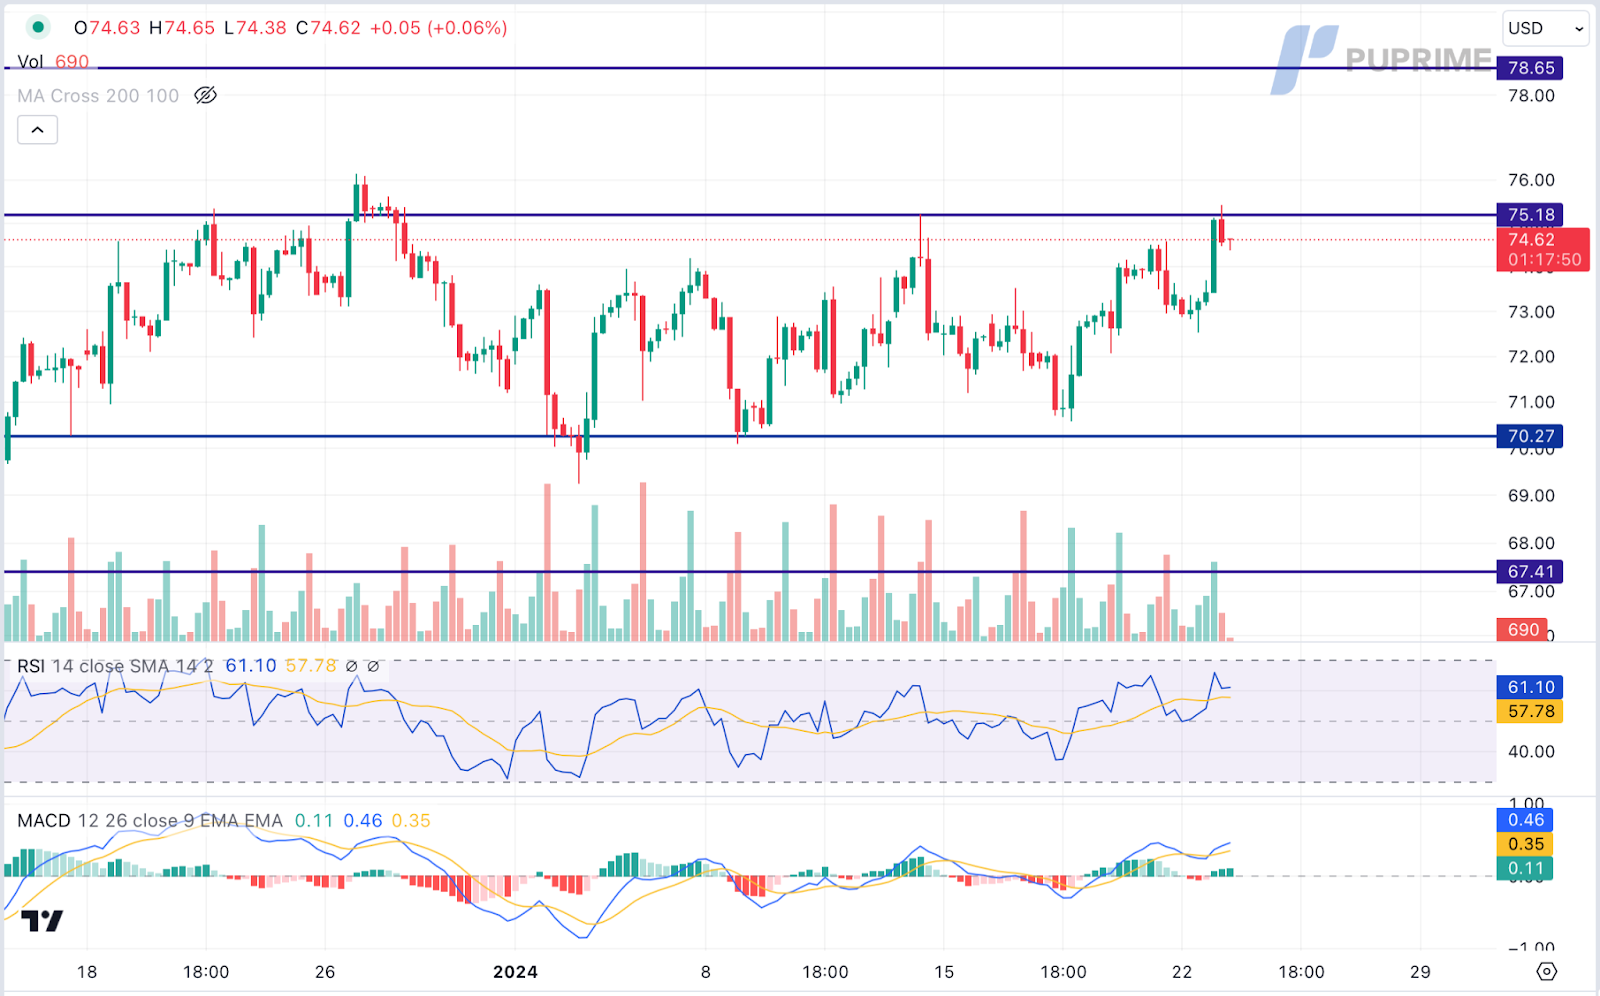
CL OIL, H4
Oil prices extended gains, fueled by escalating concerns over global energy supplies. Ukrainian drone strikes on Russia’s Novatek fuel terminal and extreme cold weather disrupting U.S. crude production contributed to the bullish momentum. Operational challenges and severe cold weather in North Dakota led to over 20% of output remaining shut in, intensifying worries about supply disruptions. Additionally, rising tensions in the Red Sea, triggered by retaliatory measures from the United States, added further uncertainties, heightening the appeal for oil prices..
Oil prices are trading higher while currently testing the resistance level. MACD has illustrated increasing bullish momentum, while RSI is at 61, suggesting the commodity might extend its gains after breakout since the RSI stays above the midline.
Resistance level: 75.20, 78.65
Support level: 70.25, 67.40
Inizia a Fare Trading con un Vantaggio
Scambia forex, indici, Metalli e altro ancora a spread bassi e con un'esecuzione fulminea.
Inizia a fare trading con depositi a partire da $50 sui nostri conti standard.
Ottieni accesso all’assistenza 24/7
Accedi a centinaia di strumenti, a strumenti didattici gratuiti e ad alcune delle migliori promozioni in circolazione.
Please note the Website is intended for individuals residing in jurisdictions where accessing the Website is permitted by law.
Please note that PU Prime and its affiliated entities are neither established nor operating in your home jurisdiction.
By clicking the "Acknowledge" button, you confirm that you are entering this website solely based on your initiative and not as a result of any specific marketing outreach. You wish to obtain information from this website which is provided on reverse solicitation in accordance with the laws of your home jurisdiction.
Ten en cuenta que el sitio web está destinado a personas que residen en jurisdicciones donde el acceso al sitio web está permitido por la ley.
Ten en cuenta que PU Prime y sus entidades afiliadas no están establecidas ni operan en tu jurisdicción de origen.
Al hacer clic en el botón "Aceptar", confirmas que estás ingresando a este sitio web por tu propia iniciativa y no como resultado de ningún esfuerzo de marketing específico. Deseas obtener información de este sitio web que se proporciona mediante solicitud inversa de acuerdo con las leyes de tu jurisdicción de origen.