January’s inflation exceeds expectations at 0.30% monthly and 3.10% year-on-year, reinforcing the Dollar’s strength.
The Dollar Index hits a three-month high, driven by robust economic indicators, including strong job reports, GDP figures and US inflation. January’s inflation exceeds expectations at 0.30% monthly and 3.10% year-on-year, reinforcing the Dollar’s strength. Market expectations for Federal Reserve policy shift, with no March rate cut, less than a 50% chance in May, and an 80% probability for a June cut. The Dollar’s ascendancy prompts a significant downturn in gold prices, while oil remains resilient, supported by optimistic OPEC projections and geopolitical tensions. In equities, a sharp retreat follows bullish momentum, influenced by rising US Treasury yields and revised expectations of sustained higher interest rates from the Federal Reserve
Current rate hike bets on 20th March Fed interest rate decision:
Source: CME Fedwatch Tool
0 bps (92%) VS -25 bps (8%)
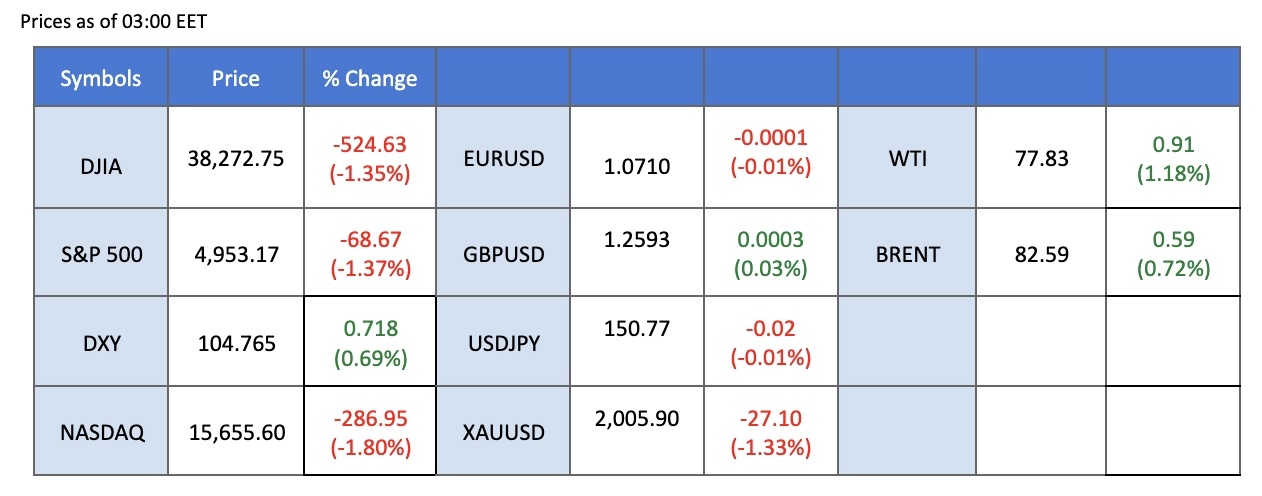
Market Overview
Economic Calendar
(MT4 System Time)
Source: MQL5
Market Movements
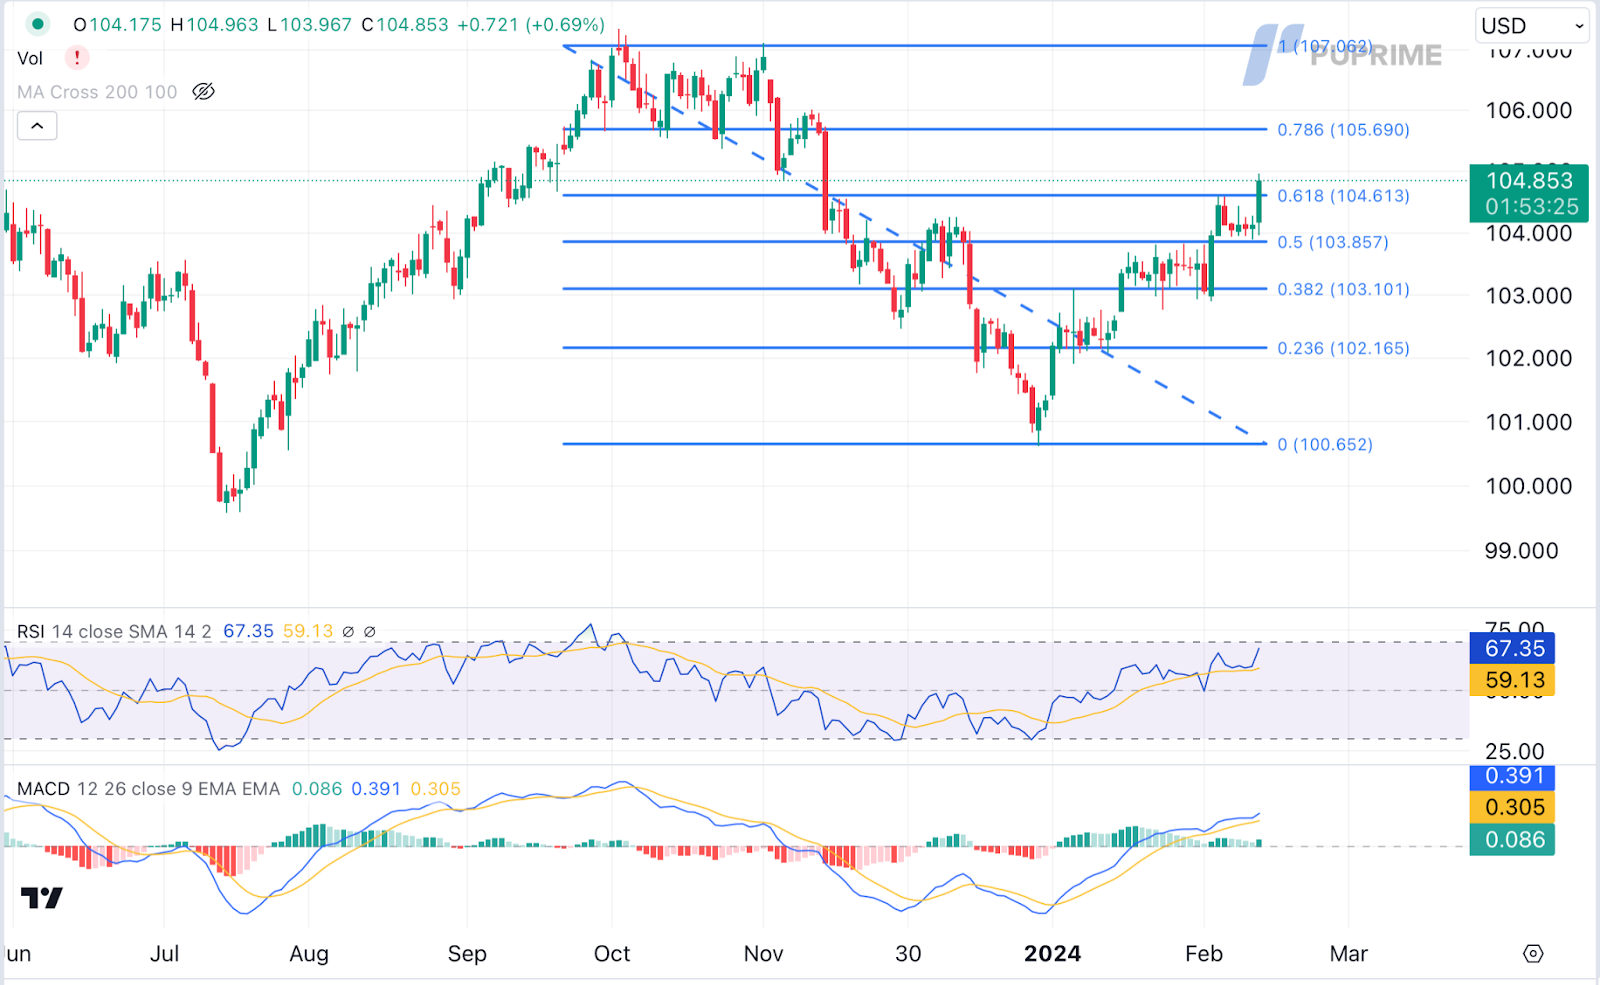
DOLLAR_INDX, H4
The Dollar Index has aggressively climbed to a three-month high, propelled by better-than-expected economic indicators. Positive data, including an optimistic jobs report and GDP figures, contributed to a January inflation increase surpassing expectations. The US Consumer Price Index (CPI) rose by 0.30% monthly and 3.10% year-on-year, exceeding economist estimates.
The Dollar Index is trading higher following the prior breakout above the previous resistance level. MACD has illustrated increasing bullish momentum, while RSI is at 67, suggesting the index might extend its gains since the RSI stays above the midline.
Resistance level: 105.70, 107.05
Support level: 103.85, 103.10
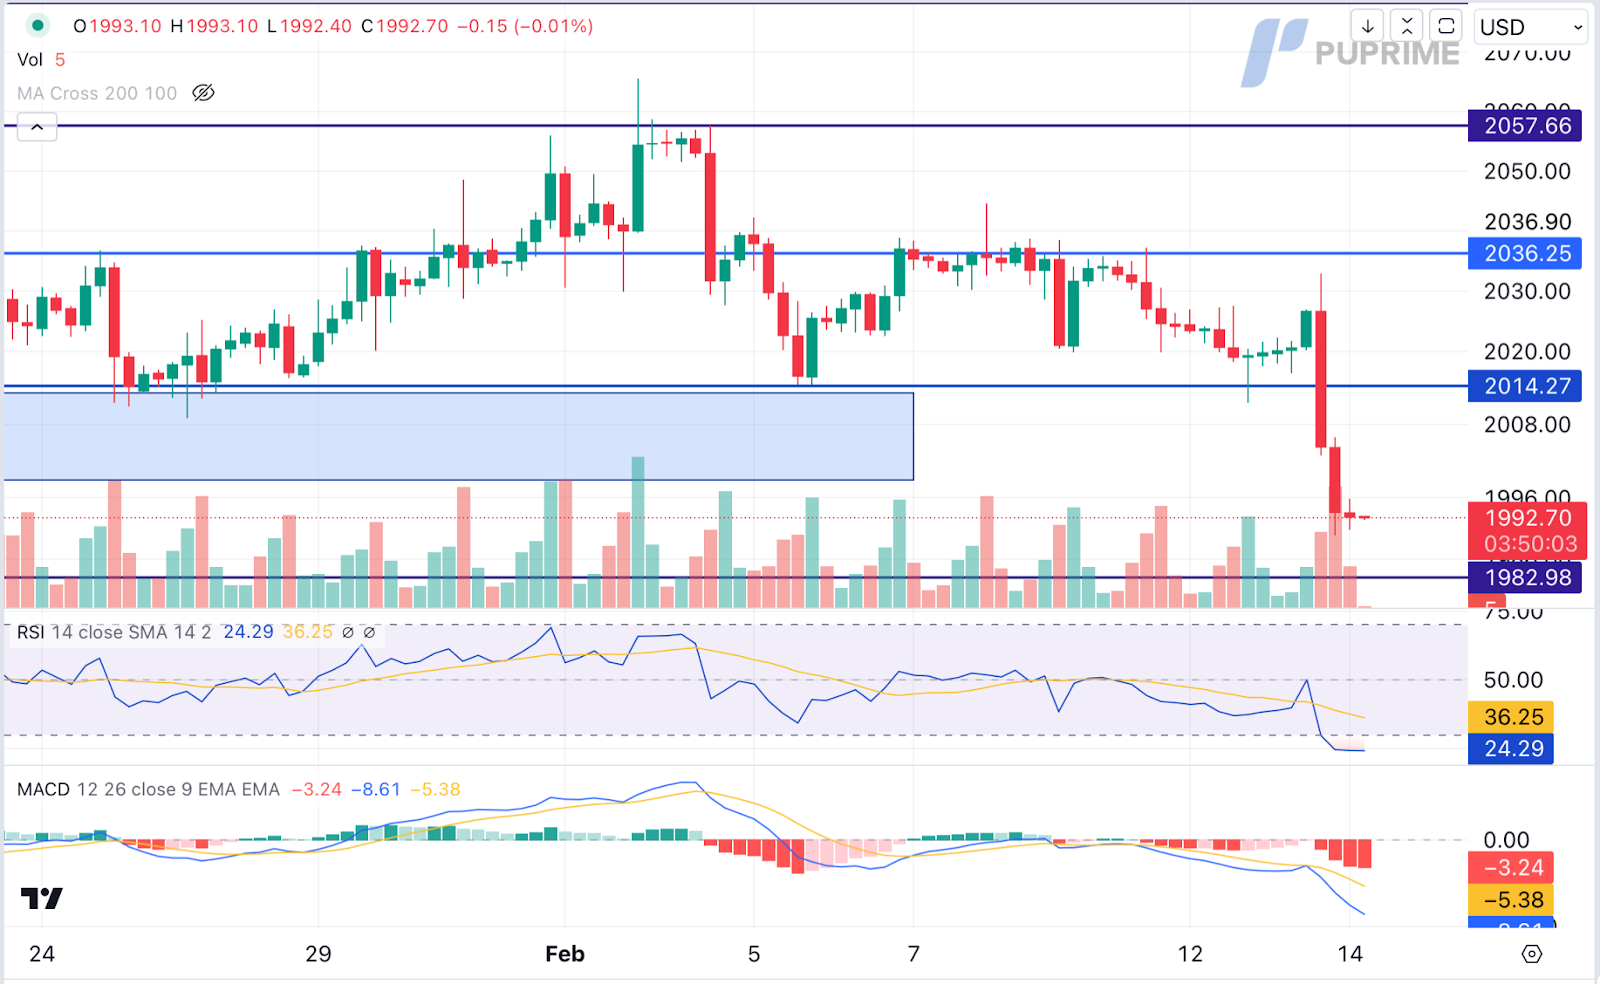
XAU/USD, H4
Gold prices experienced a significant tumble due to the strengthening US Dollar. The series of upbeat economic data, coupled with rising Treasury yields, has led market participants to anticipate a delay in Fed rate cut policies, influencing demand for the dollar-denominated gold.
Gold prices are trading lower following the prior retracement from the resistance level. MACD has illustrated increasing bearish momentum. However, RSI is at 24, suggesting the commodity might enter oversold territory.
Resistance level: 2015.00, 2035.00
Support level: 1985.00, 1970.00
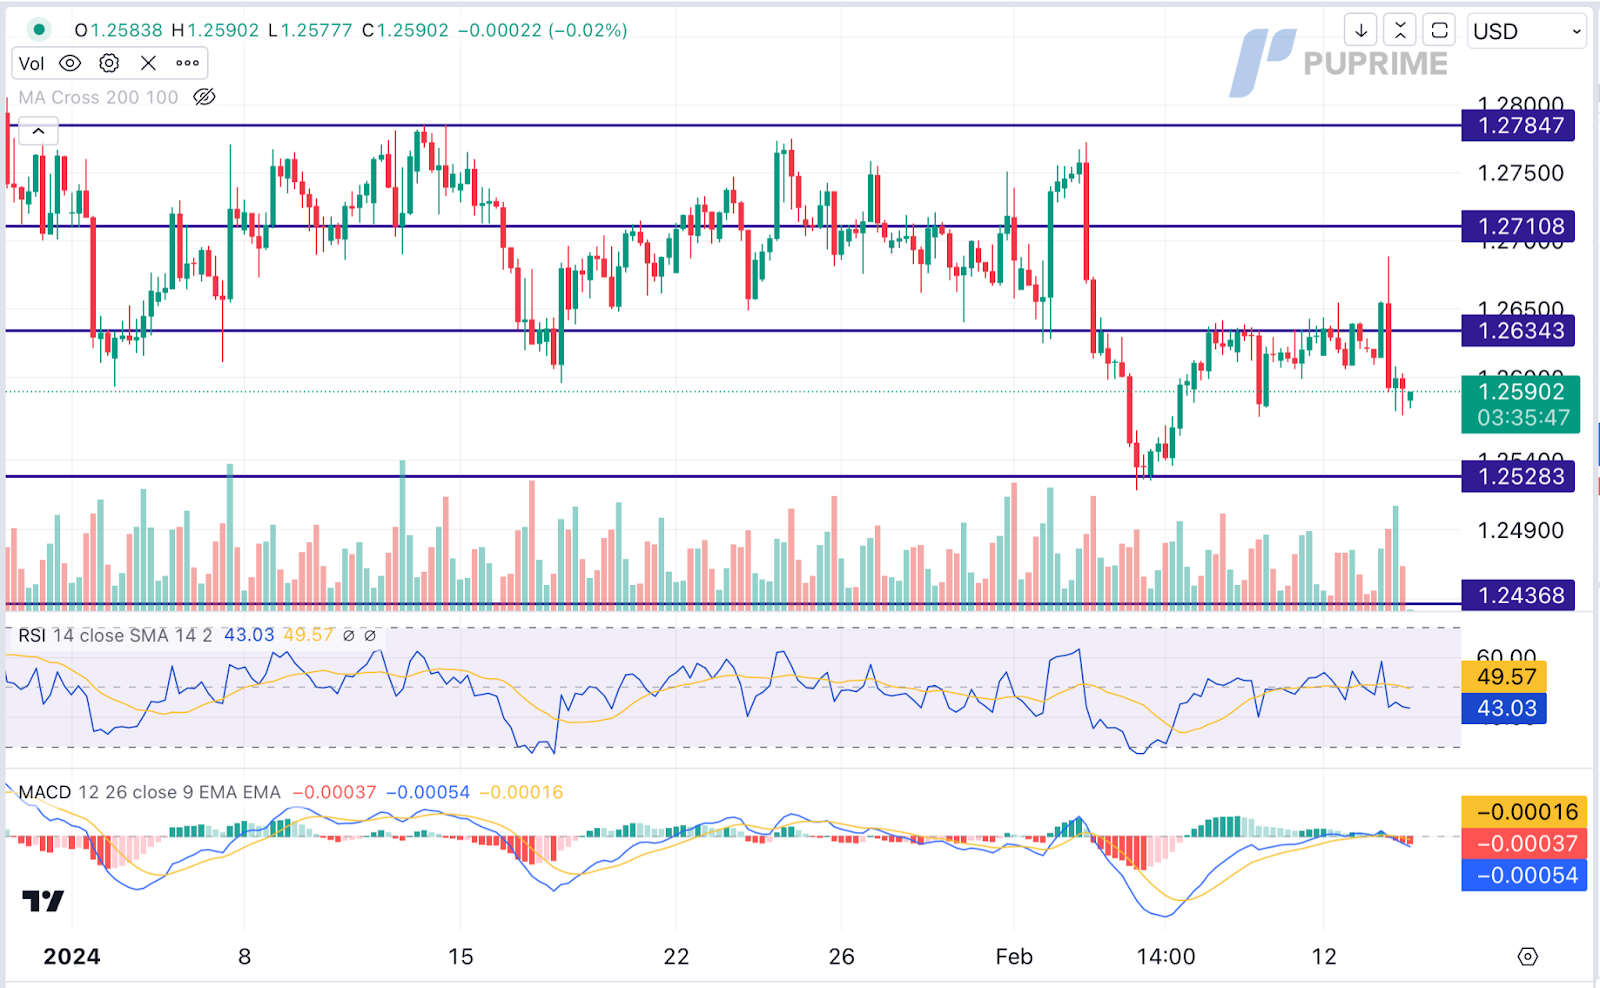
GBP/USD,H4
GBP/USD experienced a bearish trend due to the absence of market catalysts from the UK region. The appreciation of the US Dollar, driven by better-than-expected US economic data, led investors to reconsider the possibilities of a delayed rate cut from the Federal Reserve, increasing demand for the US Dollar. Moving ahead, investors are advised to continue monitoring the UK CPI report for further trading signals.
GBPUSD is trading lower following the prior retracement from the resistance level. MACD has illustrated increasing bearish momentum, while RSI is at 43, suggesting the pair might extend its losses since the RSI stays below the midline.
Resistance level: 1.2635, 1.2710
Support level:1.2530, 1.2435
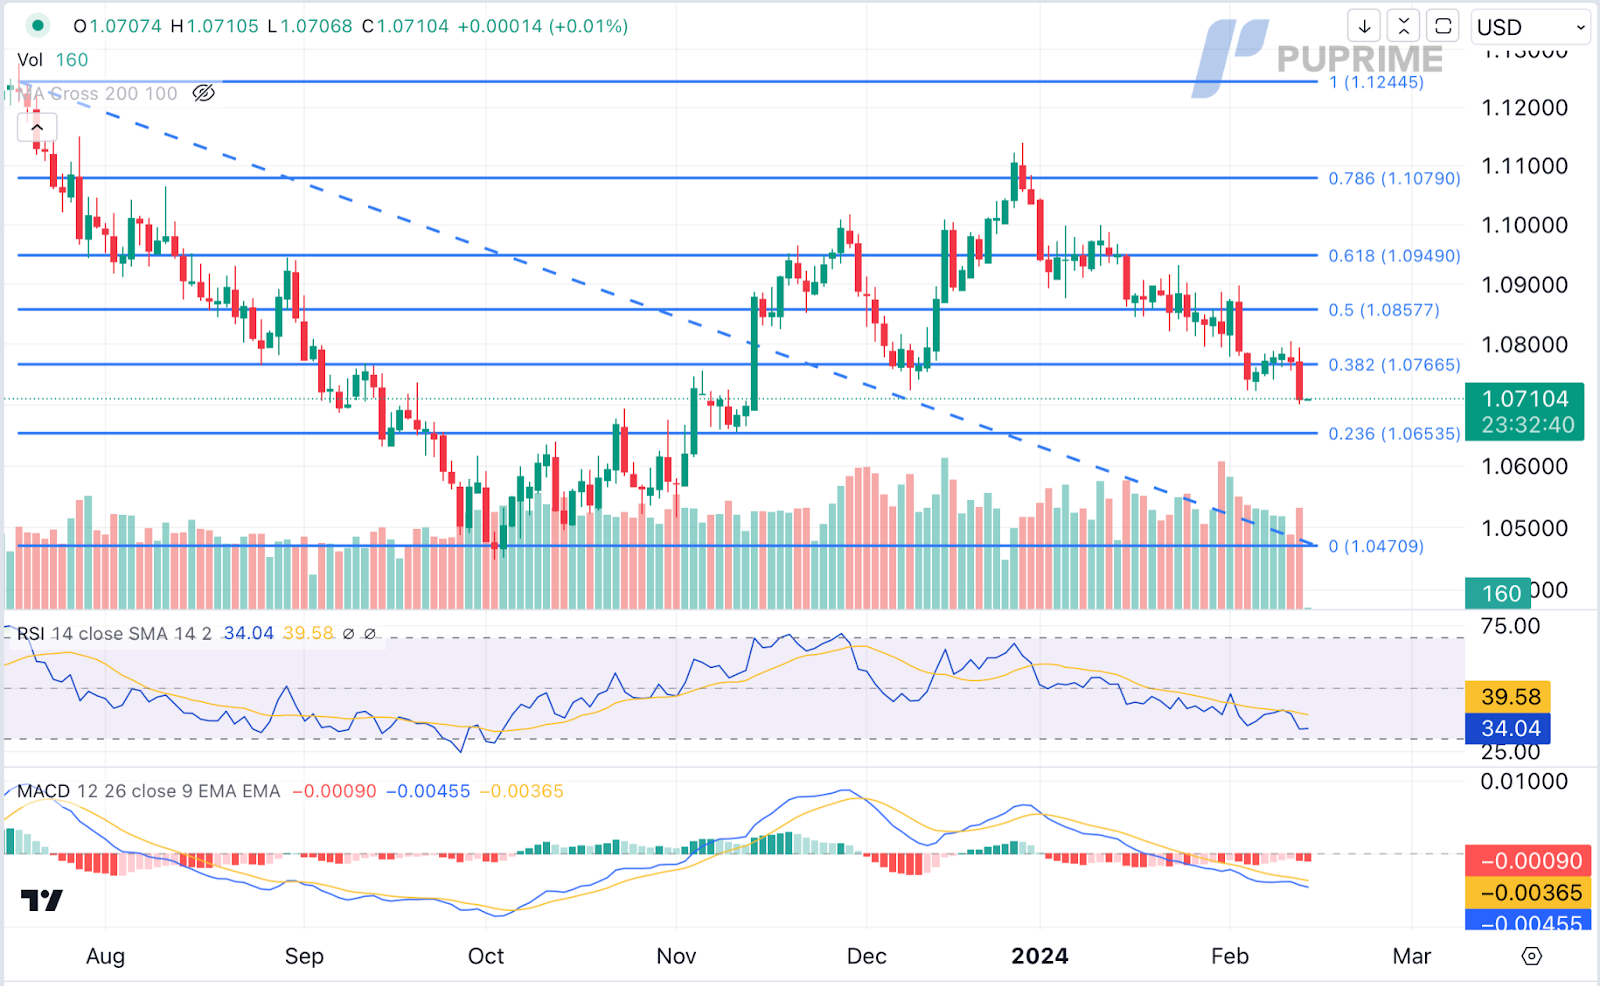
EUR/USD,H4
EUR/USD faced aggressive selling pressure after a notable resurgence in the US Dollar. The revived demand for the Greenback was fueled by a significantly better-than-expected inflation report, leading investors to consider the possibility of the Federal Reserve delaying its monetary easing program. This stands in contrast to the monetary decisions of the European Central Bank. On the EU front, ZEW officials reported a decline in respondents’ evaluation of the current economic situation to its lowest point since June 2020, signalling concerns for the German economy.
EUR/USD is trading lower following the prior breakout below the previous support level. MACD has illustrated increasing bearish momentum, while RSI is at 34, suggesting the pair might extend its losses since the RSI stays below the midline.
Resistance level: 1.0765, 1.0855
Support level: 1.0655, 1.0470
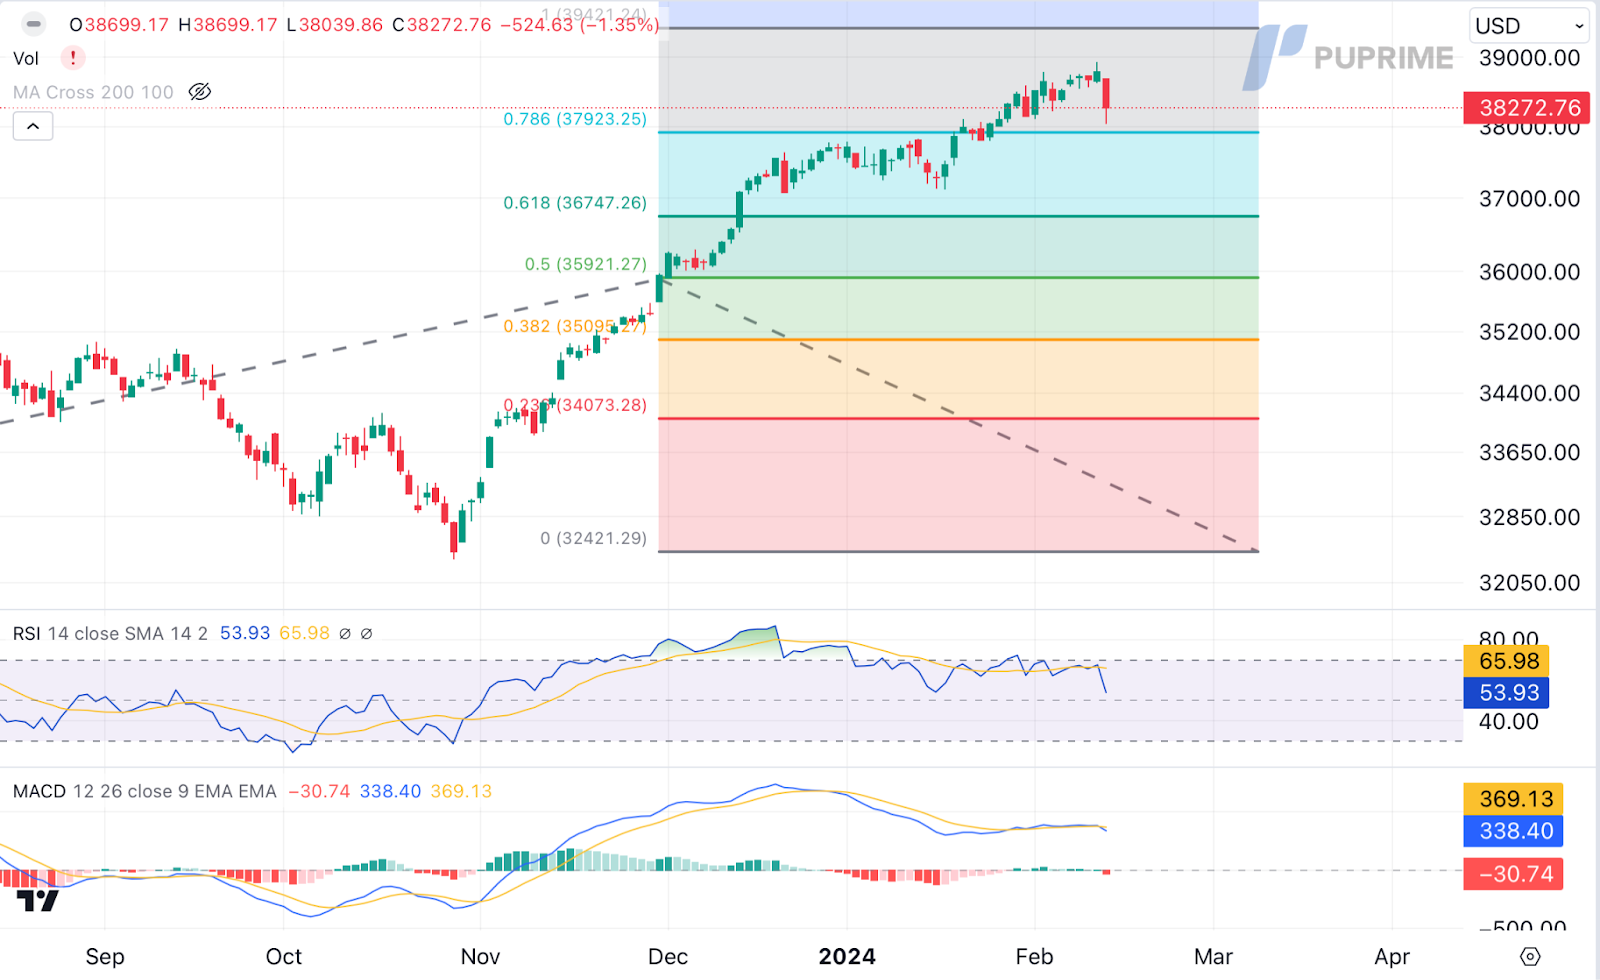
Dow Jones,H4
Despite the earlier bullish momentum, the US equity market began a sharp retreat. Rising US Treasury yields and the expectation that the Fed might maintain higher interest rates prompted technical corrections and profit-taking. The recent economic data has led investors to reassess their positions.
Dow Jones is trading lower while currently testing the support level. MACD has illustrated increasing bearish momentum, while RSI is at 54, suggesting the index might extend its losses since the RSI stays below the midline.
Resistance level: 39420.00, 40000.00
Support level: 37925.00, 36745.00
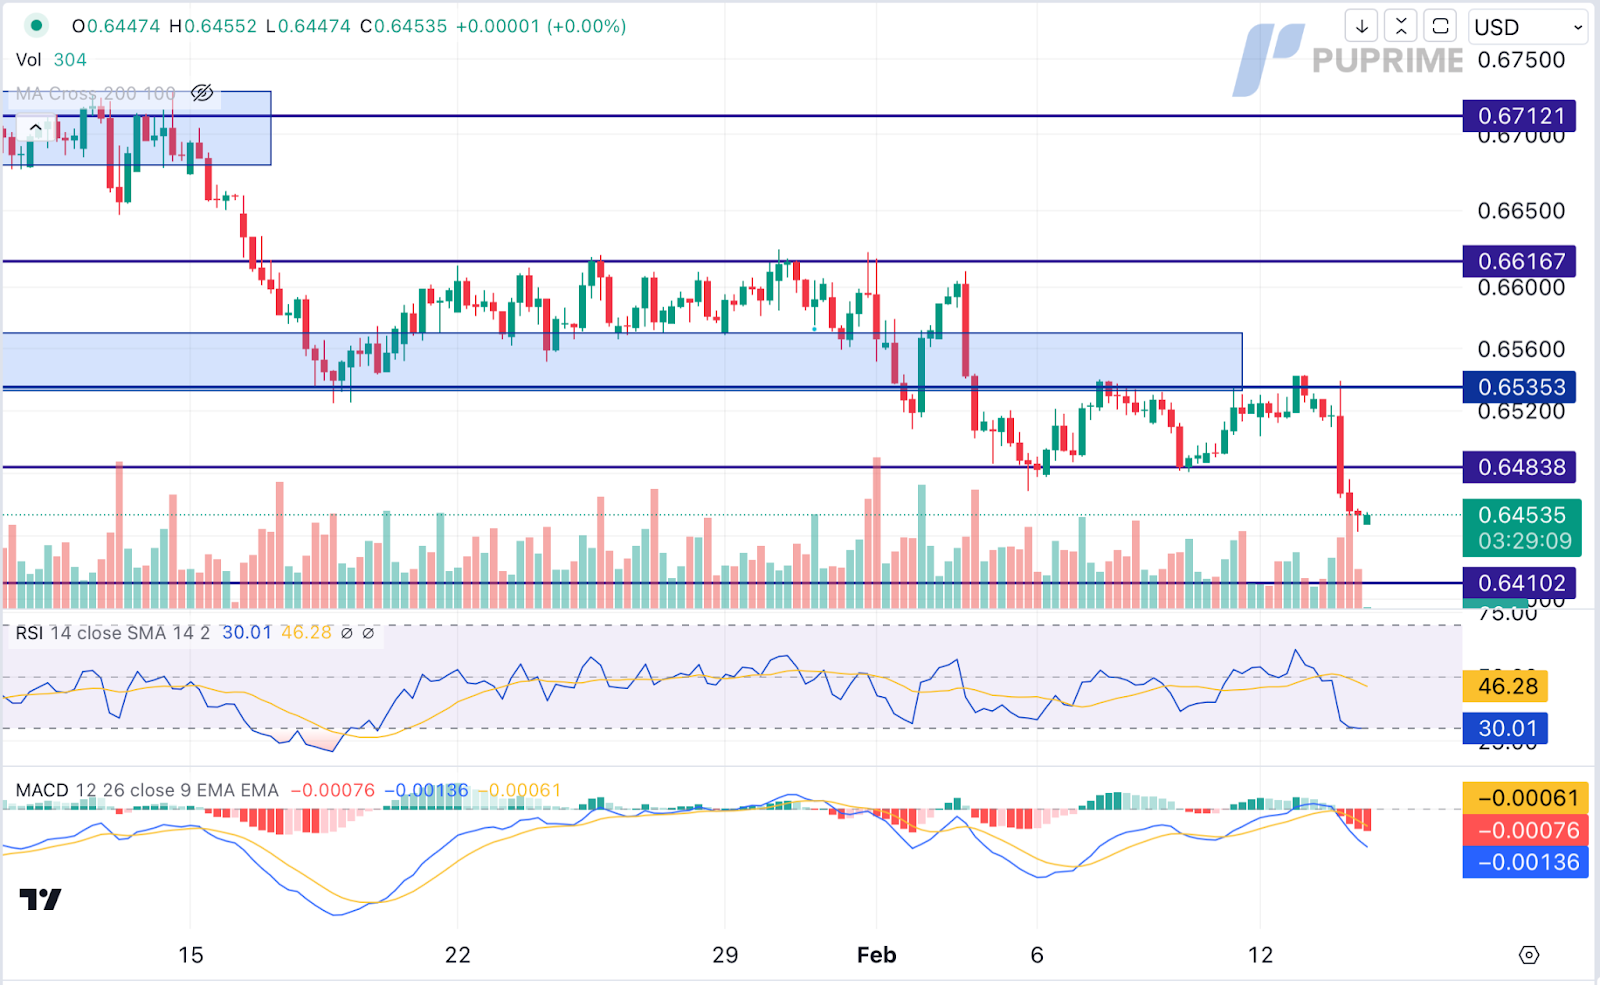
AUDUSD, H4
AUD/USD faced renewed selling pressure amid a sudden and strong rebound in the US Dollar, exacerbated by higher-than-expected US inflation figures in January. The robust inflation report prompted a repricing of expectations for a potential rate cut by the Federal Reserve, now anticipated later than initially expected. On the Australia front, the Reserve Bank of Australia (RBA) slightly revised downward its inflation forecasts, projecting both indicators to remain below 3% by the fourth quarter of 2025. Simultaneously, the RBA lowered its GDP growth projections, reflecting a less optimistic outlook for the Australian economy.
AUD/USD is trading higher while currently testing the resistance level. However, MACD has illustrated diminishing bullish momentum, while RSI is at 51, suggesting the pair might experience technical correction since the RSi retreated sharply from overbought territory.
Resistance level: 0.6535, 0.6615
Support level: 0.6485, 0.6410
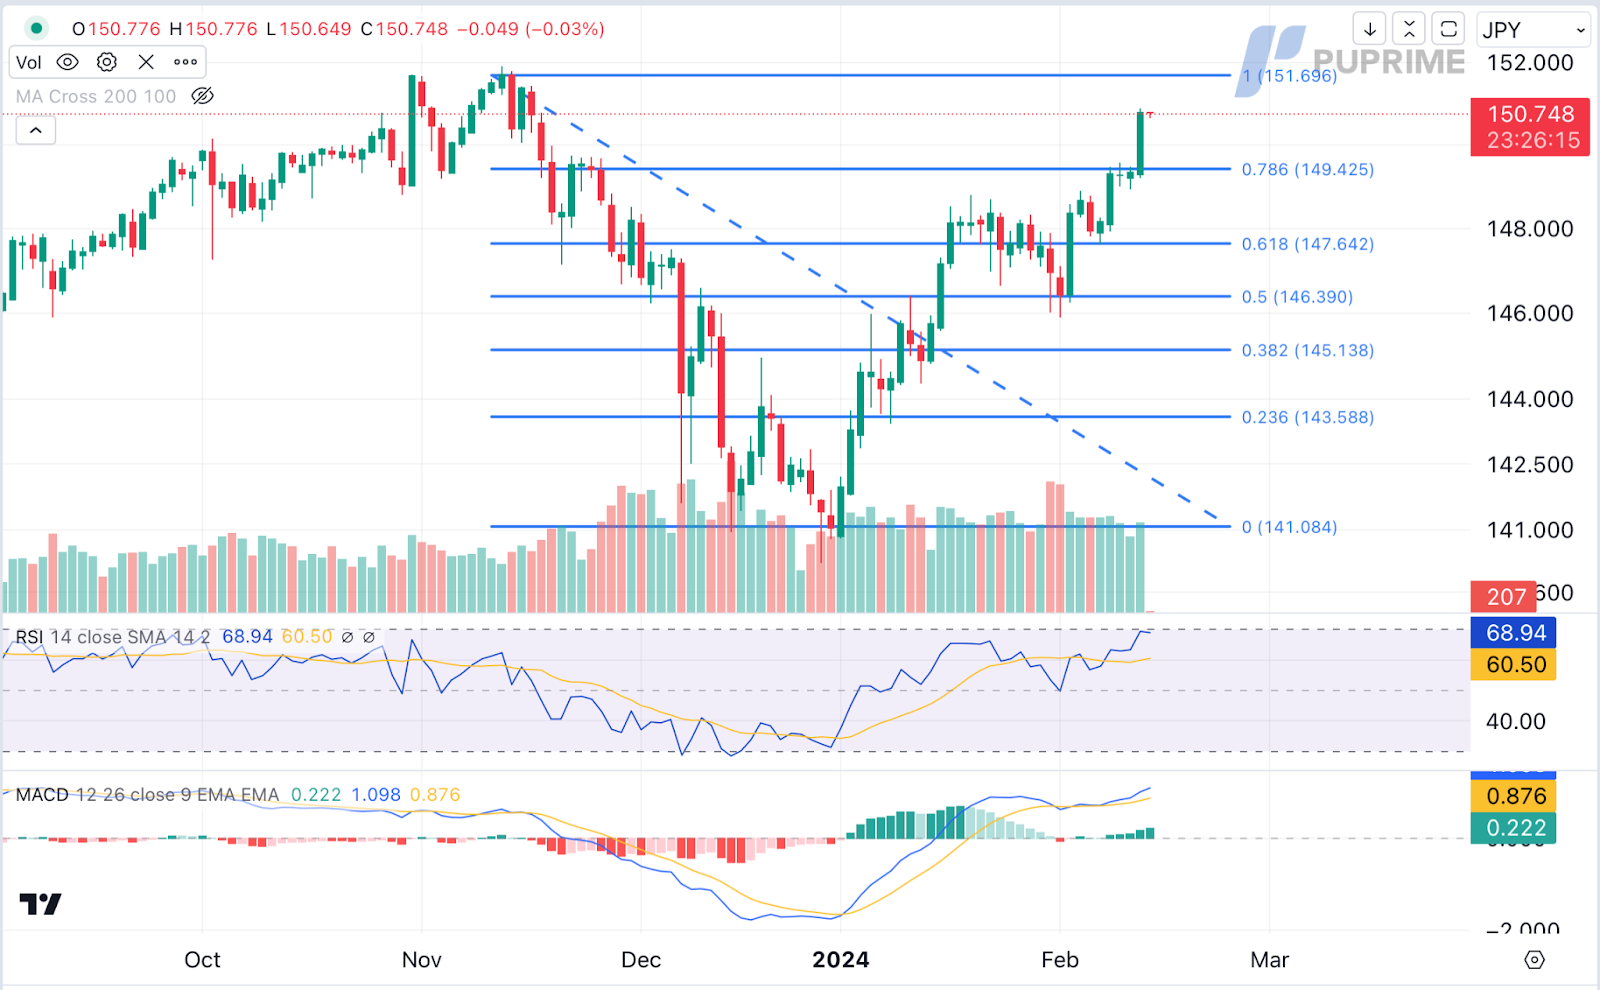
USD/JPY, H4
USD/JPY surged to a three-month peak following the release of the US Bureau of Labor Statistics (BLS) data, revealing that US inflation, while slowing down, remains above the 3% threshold. This persistent inflation report has been a catalyst for lifting US Treasury yields, further widening the yield differential between Japanese and US markets. The US Consumer Price Index (CPI) exceeded expectations, growing by 3.1% year-on-year, albeit slightly below last month’s 3.4% reading.
USD/JPY is trading higher following the prior breakout above the resistance level. MACD has illustrated increasing bullish momentum, while RSI is at 69, suggesting the pair might extend its gains since the RSI stays above the midline.
Resistance level: 151.70, 152.50
Support level: 149.45, 147.65
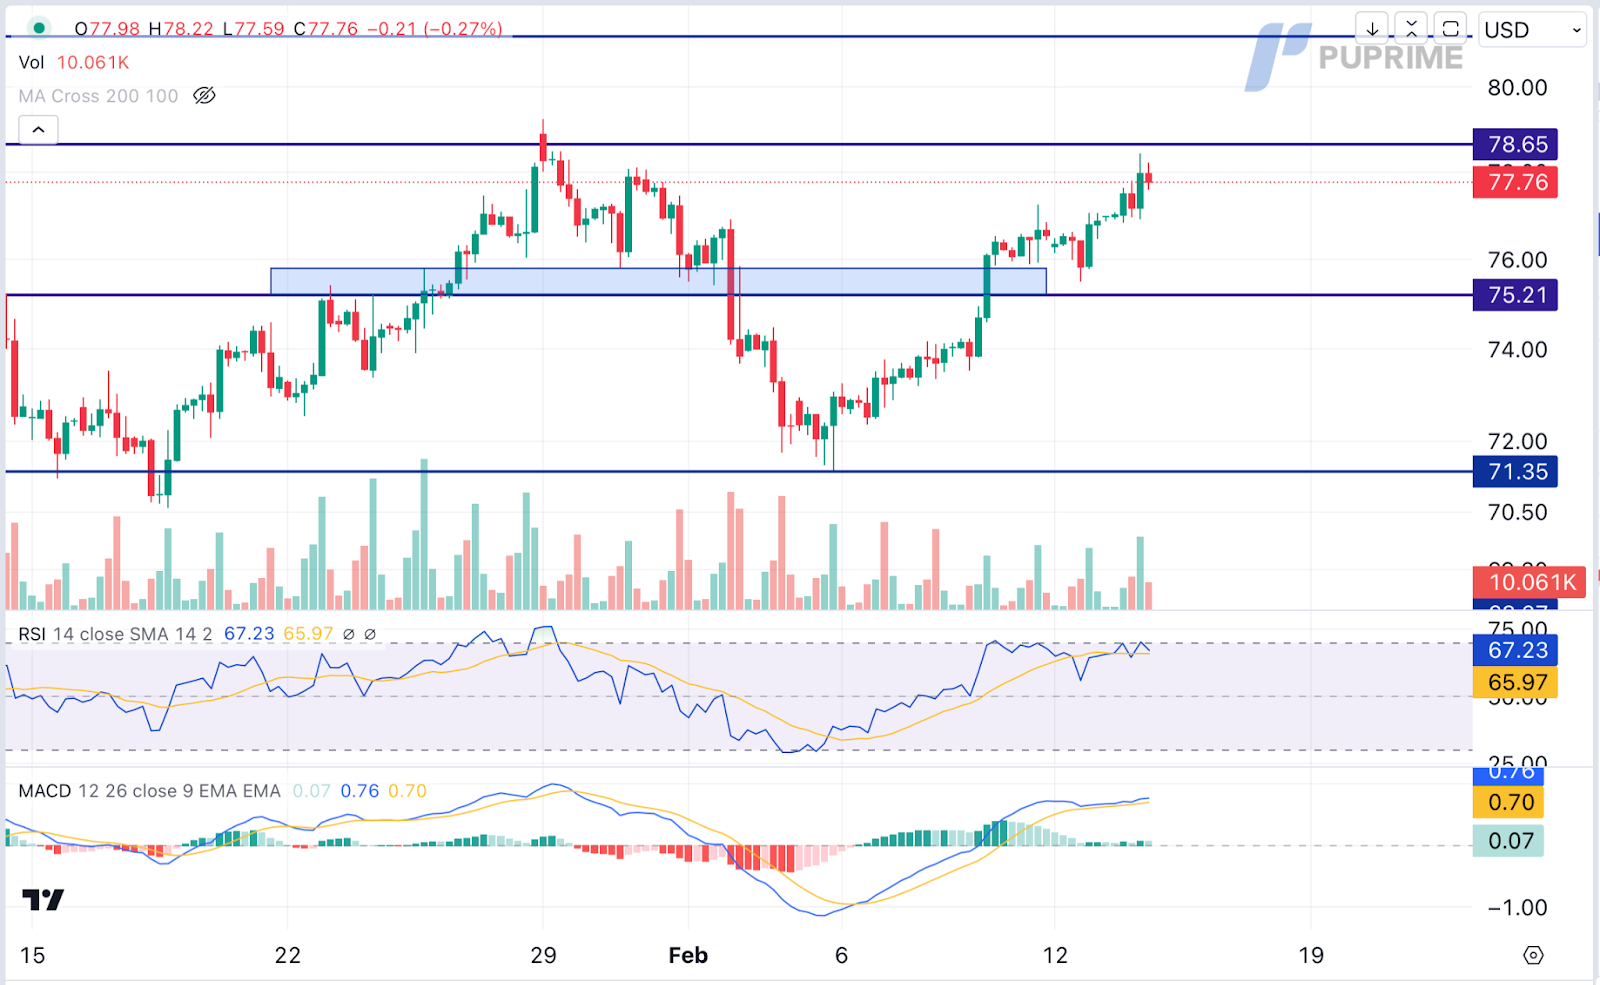
CL OIL, H4
Oil prices maintained their bullish trajectory despite a stronger US Dollar. Ongoing geopolitical tensions and an optimistic demand outlook counterbalanced the impact of the dollar surge. OPEC’s positive outlook, expecting a 2.2 million barrel per day rise in crude oil demand for the year, contributes to a supportive oil market, while geopolitical concerns, including Gaza ceasefire talks, remain on the radar.
Oil prices are trading higher following the prior breakout above the resistance level. However, MACD has illustrated diminishing bullish momentum, while RSI is at 67, suggesting the commodity might experience technical correction since the RSI retreated sharply from overbought territory.
Resistance level: 78.65, 81.20
Support level: 75.20, 71.35
Inizia a Fare Trading con un Vantaggio
Scambia forex, indici, Metalli e altro ancora a spread bassi e con un'esecuzione fulminea.
Inizia a fare trading con depositi a partire da $50 sui nostri conti standard.
Ottieni accesso all’assistenza 24/7
Accedi a centinaia di strumenti, a strumenti didattici gratuiti e ad alcune delle migliori promozioni in circolazione.
Please note the Website is intended for individuals residing in jurisdictions where accessing the Website is permitted by law.
Please note that PU Prime and its affiliated entities are neither established nor operating in your home jurisdiction.
By clicking the "Acknowledge" button, you confirm that you are entering this website solely based on your initiative and not as a result of any specific marketing outreach. You wish to obtain information from this website which is provided on reverse solicitation in accordance with the laws of your home jurisdiction.
Ten en cuenta que el sitio web está destinado a personas que residen en jurisdicciones donde el acceso al sitio web está permitido por la ley.
Ten en cuenta que PU Prime y sus entidades afiliadas no están establecidas ni operan en tu jurisdicción de origen.
Al hacer clic en el botón "Aceptar", confirmas que estás ingresando a este sitio web por tu propia iniciativa y no como resultado de ningún esfuerzo de marketing específico. Deseas obtener información de este sitio web que se proporciona mediante solicitud inversa de acuerdo con las leyes de tu jurisdicción de origen.