The market exhibited relative quietness in yesterday’s trading session as investors positioned themselves ahead of Friday’s release of the PCE index. There is a palpable sense of confusion among market participants regarding the Federal Reserve’s forthcoming monetary policy. While the U.S. central bank remains steadfast in its commitment to implementing rate cuts this year, concerns persist over the sustained inflationary pressures witnessed in recent months. Consequently, the dollar index, equity markets, and gold traded with subdued activity.
In contrast, oil prices continued their ascent, moving in an upward trajectory. This momentum can be attributed to the OPEC+ group’s affirmation of its policy of production cuts, against the backdrop of ongoing geopolitical uncertainties in the Middle East and Russia.
Meanwhile, BTC took centre stage during yesterday’s trading, experiencing a gain of over 7%. This surge follows a period of significant outflows from BTC ETFs in the previous week. Traders appeared inclined to buy the dip, propelling BTC prices once again above the $70,000 mark.
Current rate hike bets on 1st May Fed interest rate decision:
Source: CME Fedwatch Tool
0 bps (90.0%) VS -25 bps (10%)
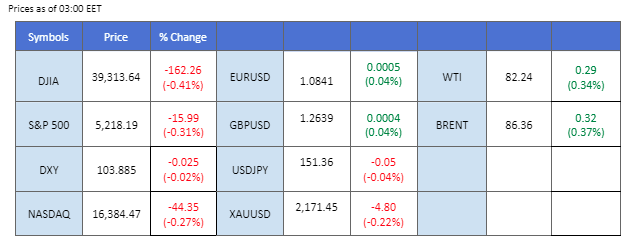
Market Overview
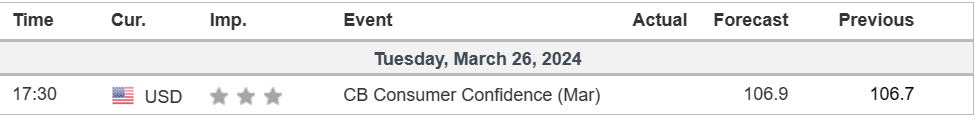
Economic Calendar
(MT4 System Time)
Source: MQL5
Market Movements
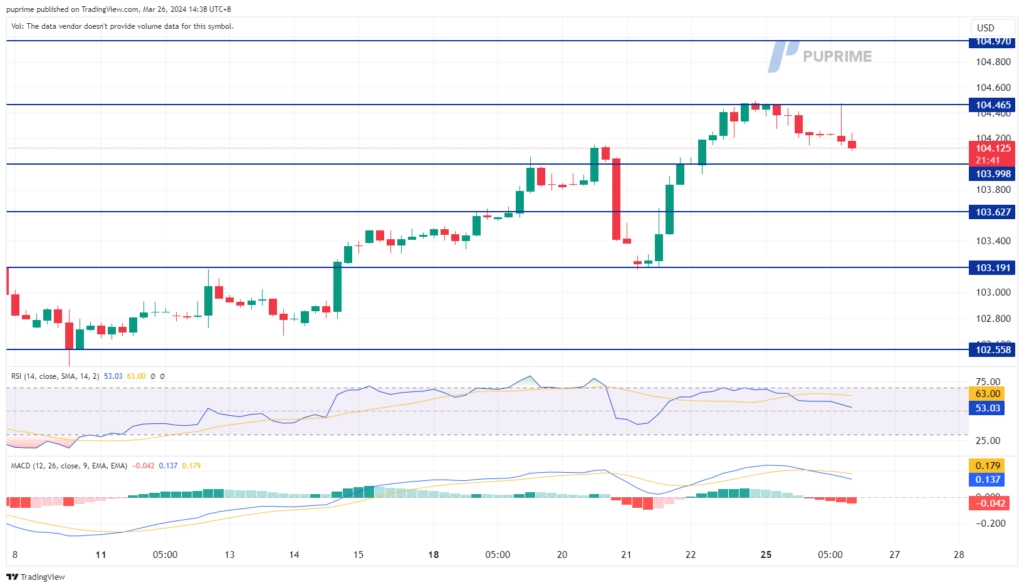
DOLLAR_INDX, H4
The Dollar Index maintained a neutral stance as market participants adopted a cautious “wait-and-see” approach, awaiting crucial insights into inflation dynamics and the Federal Reserve’s forthcoming decisions. Attention remains focused on Friday’s release of the PCE Price Index, the Fed’s preferred inflation metric, amid the central bank’s emphasis on inflation nearing its 2% annual target as a prerequisite for any interest rate adjustments in 2024. With market volatility prevailing, investors hesitated to take significant positions, resulting in a flat trend for the dollar.
The Dollar Index is trading lower following the prior retracement from the resistance level. MACD has illustrated increasing bearish momentum, while RSI is at 56, suggesting the index might extend its losses since the RSI retreated sharply from overbought territory.
Resistance level: 104.45, 104.95
Support level:104.05, 103.75
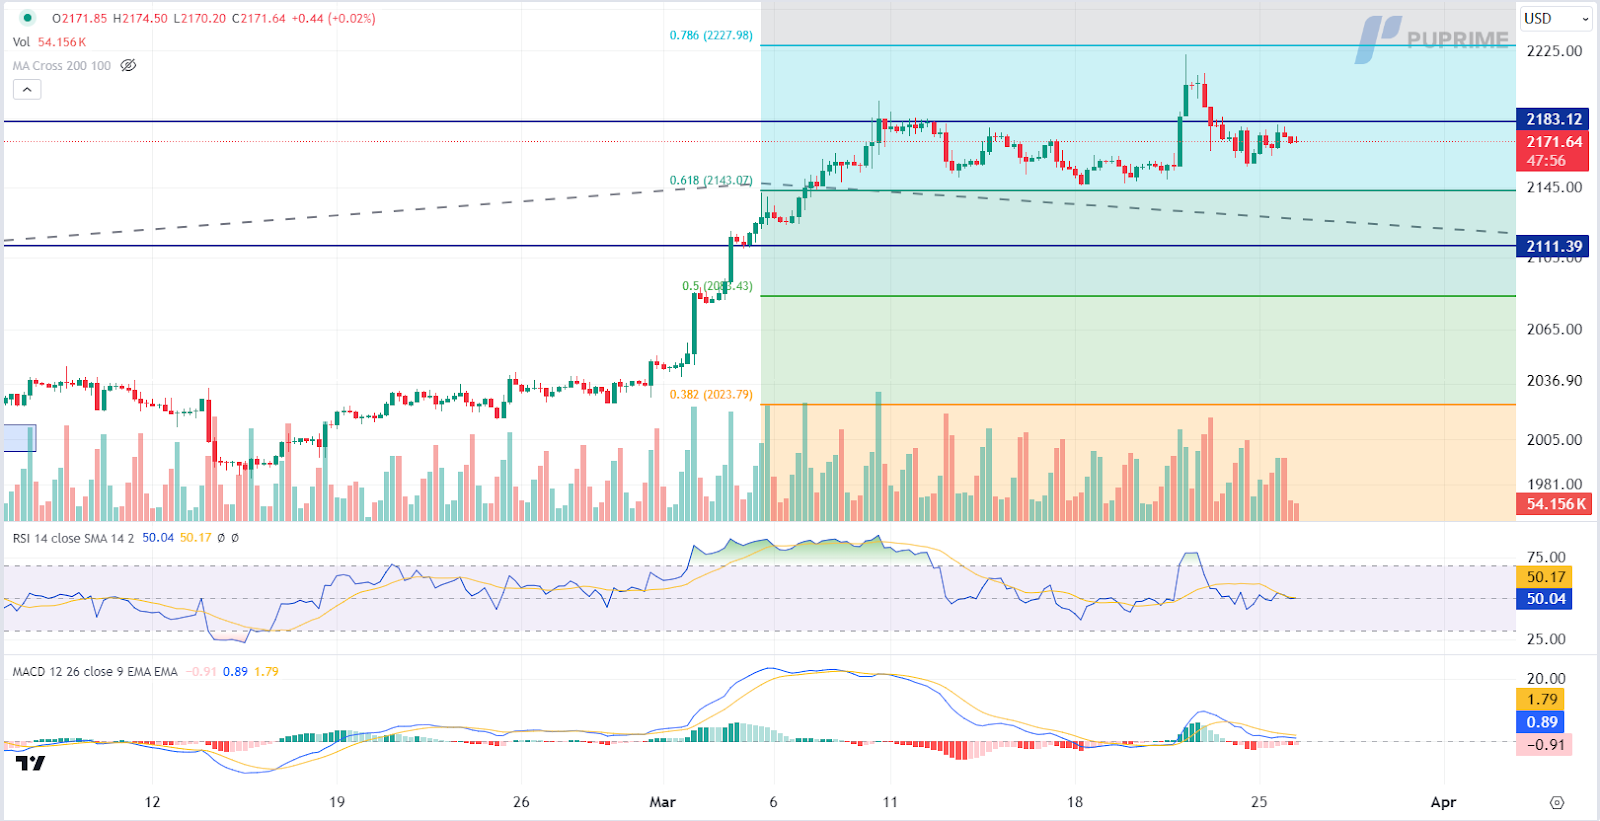
XAU/USD, H4
Despite experiencing a sharp retreat fueled by hawkish sentiments from the Federal Reserve, gold prices managed to stabilise as certain investors sought refuge in the safe-haven asset. However, the outlook for gold remains mixed, with the potential for a Gaza ceasefire dampening demand, while heightened market volatility ahead of key events could spur renewed interest in gold as a hedge.
Gold prices are trading lower following the prior breakout below the previous support level. However, MACD has illustrated diminishing bearish momentum, while the RSI is at 50, suggesting the commodity might continue to consolidate in a range since the RSI stays near the midline.
Resistance level: 2185.00, 2230.00
Support level: 2145.00, 2110.00
GBP/USD,H4
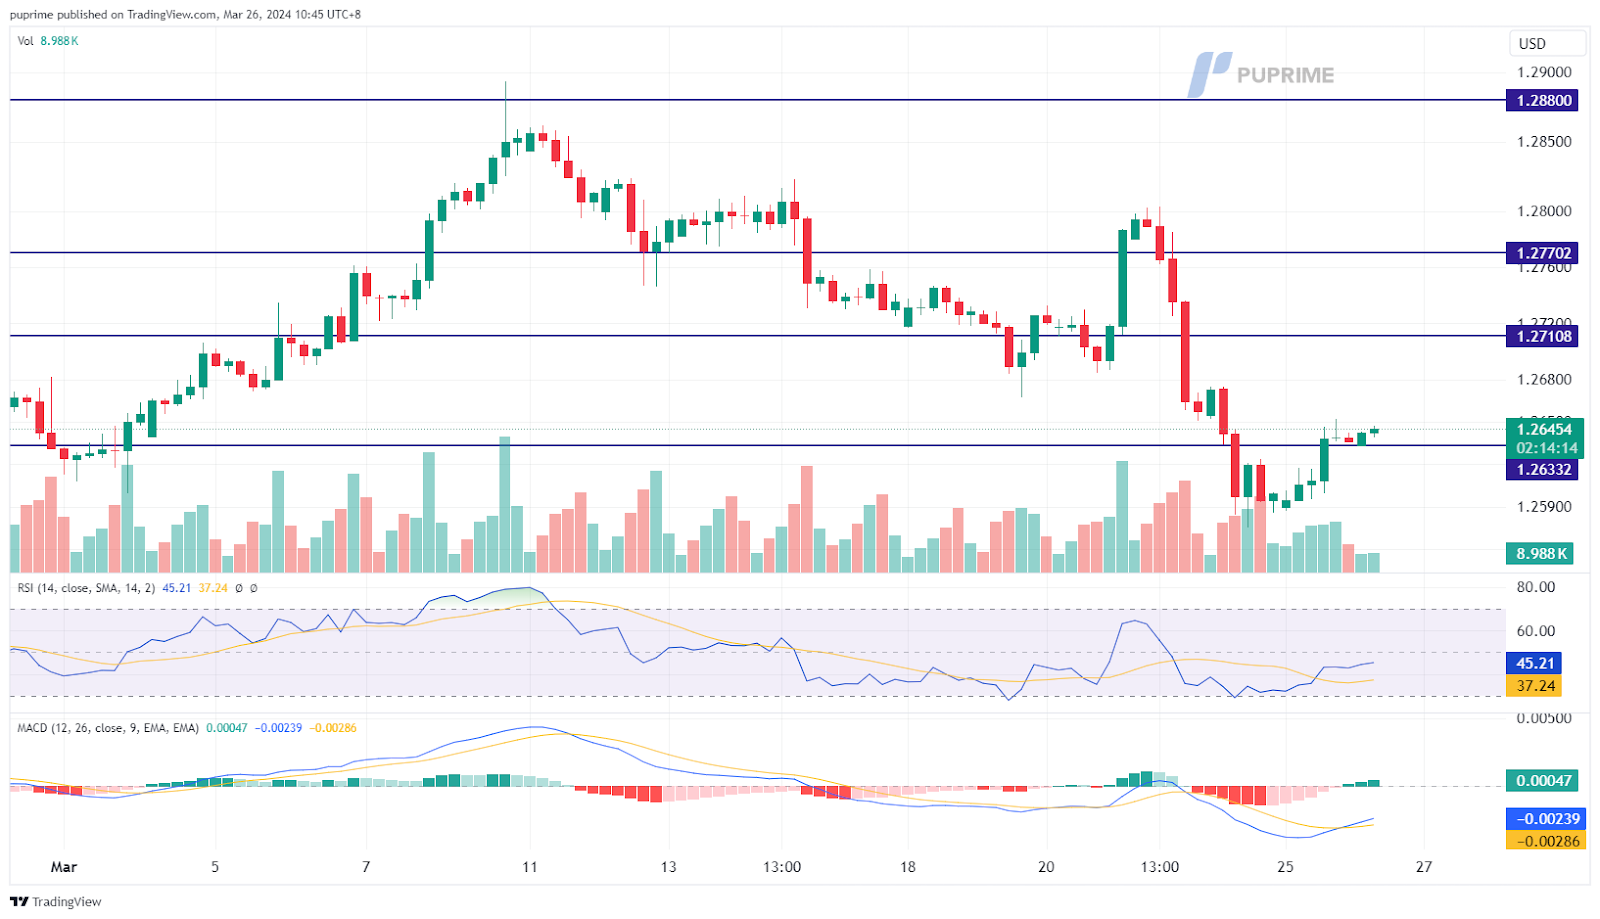
The GBP/USD currency pair demonstrated continued bullish momentum, recording marginal gains during yesterday’s session. Market participants remained cautious ahead of Friday’s release of the PCE reading, which contributed to subdued activity in the U.S. dollar. Additionally, speculation surrounding a potential rate cut from the Bank of England (BoE) exerted pressure on Sterling’s strength, particularly in light of indications of easing inflationary pressures within the country.
GBP/USD maintains above its support level at 1.2630 but remains trading with a bearish trajectory. The RSI is rebounding, while the MACD has crossed at the bottom, suggesting that the bearish momentum is easing.
Resistance level: 1.2710, 1.2770
Support level: 1.2530, 1.2440
EUR/USD,H4
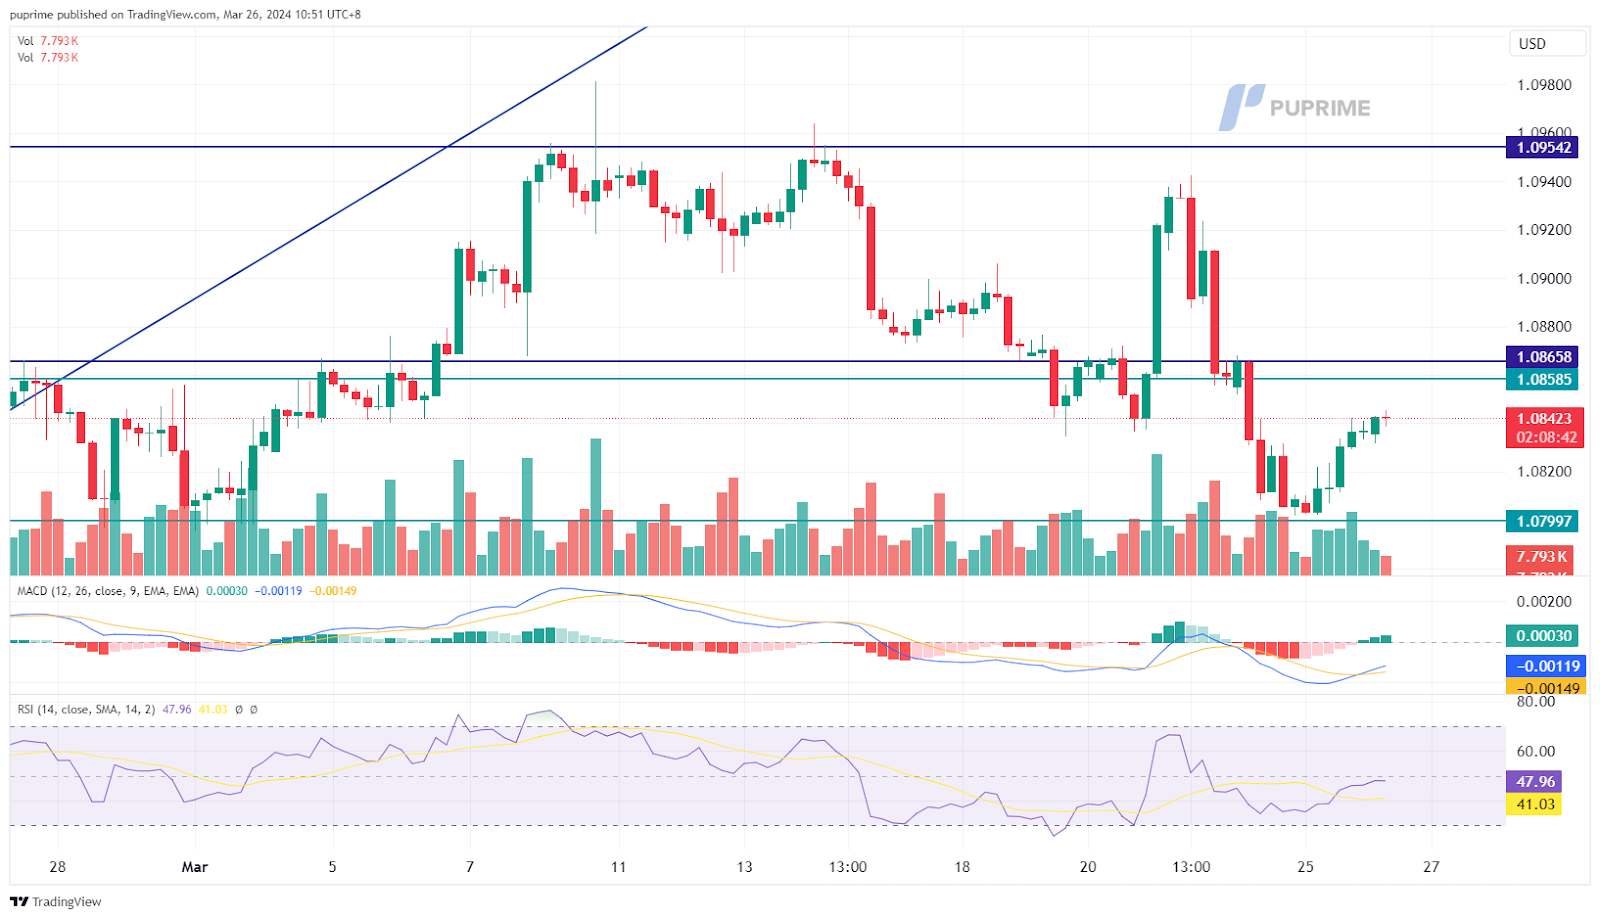
The EUR/USD pair experienced a technical rebound after suffering a substantial drop last week, driven by a strengthening U.S. dollar. However, the dollar’s momentum waned as market participants awaited the release of crucial PCE data scheduled for the upcoming Friday. This anticipation allowed the Euro to register a slight increase in strength against the U.S. dollar. On the flip side, the Eurozone’s diminishing inflation signals that the European Central Bank (ECB) may be nearing its first rate cut of the year, a move that could potentially restrain the Euro’s strength further.
EUR/USD recorded a technical rebound above 1.0800 after a significant dive. The MACD has crossed at the bottom, while the RSI is rebounding, suggesting fresh bullish momentum may be forming.
Resistance level: 1.0866, 1.0955
Support level: 1.0780, 1.0700
Nasdaq,H4
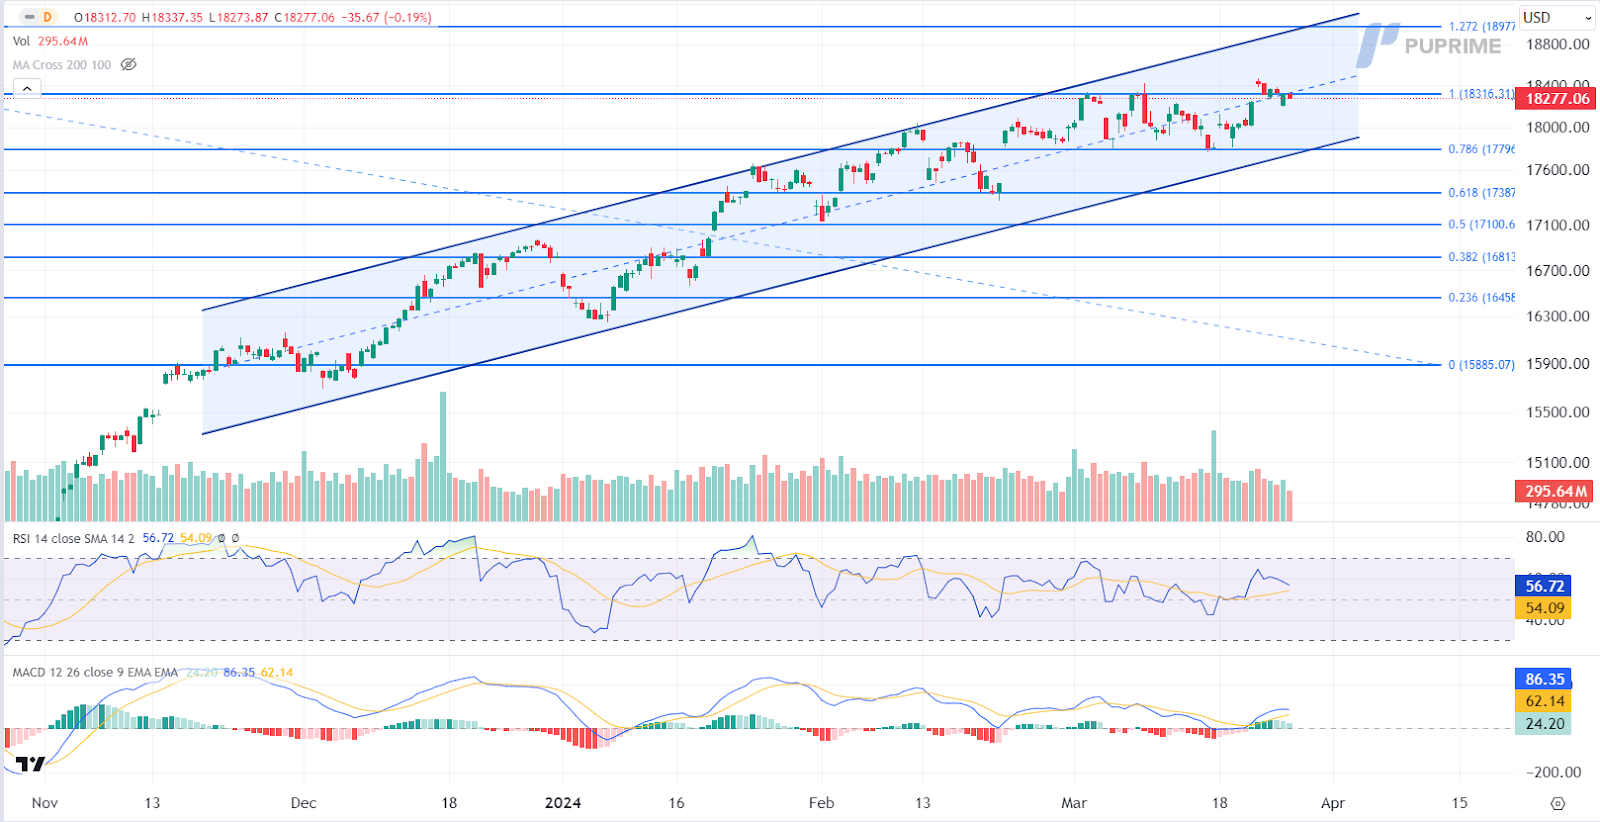
The US equity market continued its upward trajectory, propelled by a rally in artificial intelligence (AI) stocks, which spilled over into aftermarket trading. Amidst persistent enthusiasm surrounding the rapidly expanding AI sector, investors remained optimistic, particularly towards major AI-linked companies. Notable gains were observed in market favourites like NVIDIA Corporation and Micron Technology Inc, with the latter benefiting from improved prospects driven by rising demand for AI-related high-bandwidth memory chips.
Nasdaq is trading higher while currently testing the resistance level. However, MACD has illustrated diminishing bullish momentum, while RSI is at 57, suggesting the index might experience technical correction since the RSI retreated sharply from overbought territory.
Resistance level: 18315.00, 18975.00
Support level: 17795.00, 17385.00
USD/JPY, H4
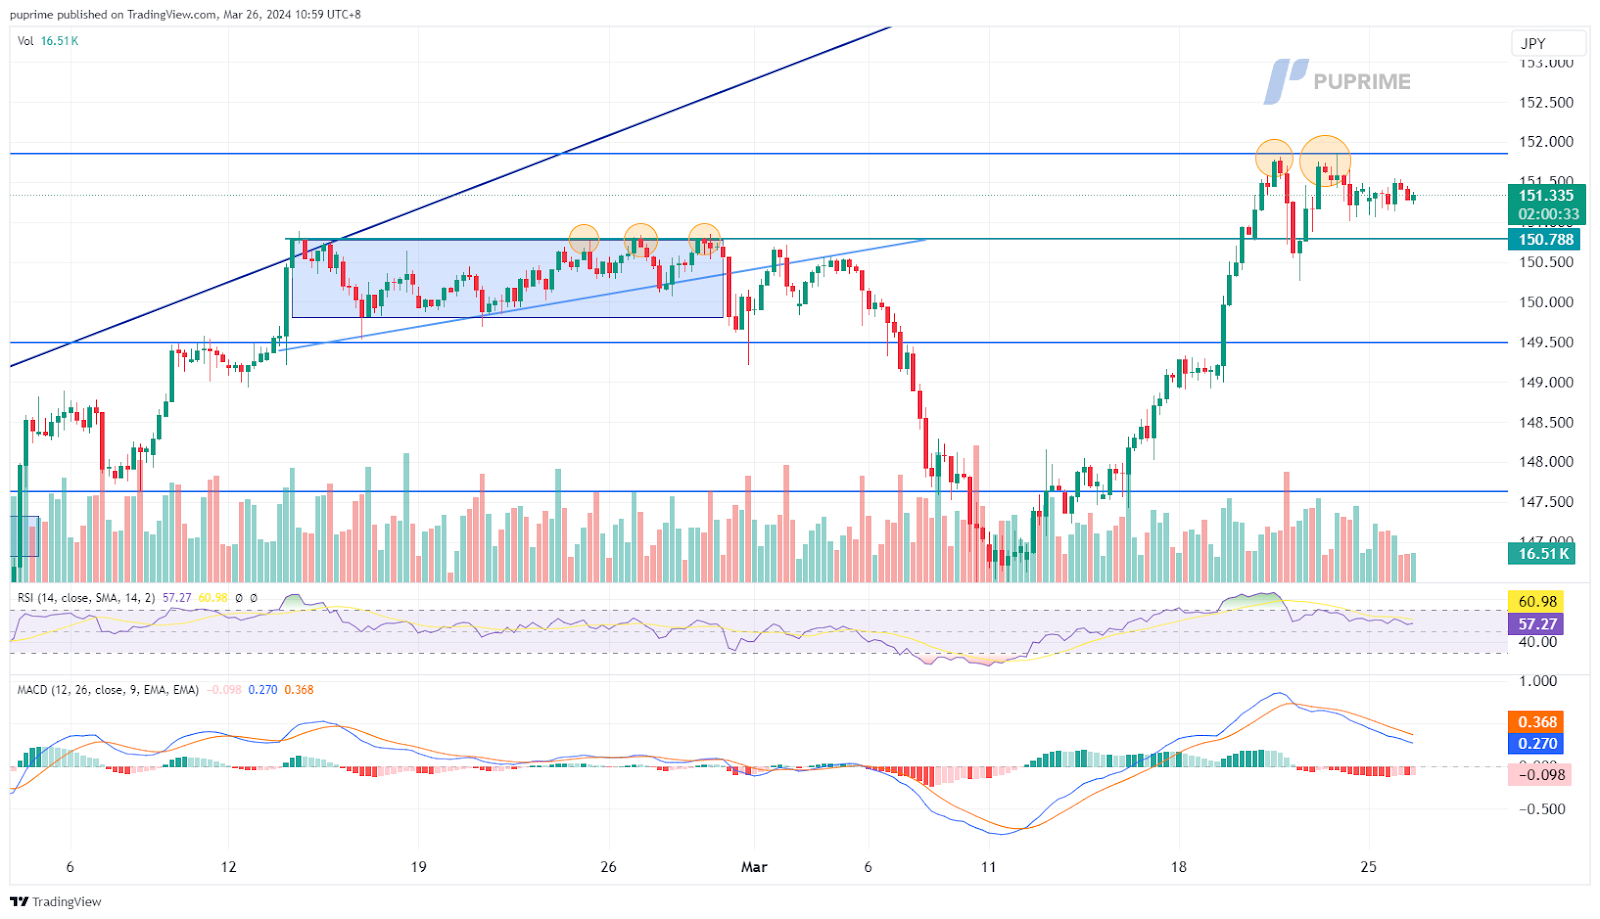
The USD/JPY pair has recently formed a double-top pattern and is currently consolidating at elevated levels following a bullish rally. With the persistent weakening of the Japanese Yen, Japanese officials have issued warnings regarding potential intervention to counteract the Yen’s decline. This has sparked speculation in the market about imminent intervention by Japanese authorities, leading to a slight strengthening of the Japanese Yen.
The USD/JPY pair has been consolidating for the past few sessions, and a double-top pattern has formed. The RSI has dropped out from the overbought zone, while the MACD has crossed at the top and is edging lower, suggesting that the bullish momentum is vanishing.
Resistance level: 151.85, 153.35
Support level: 149.50, 147.65
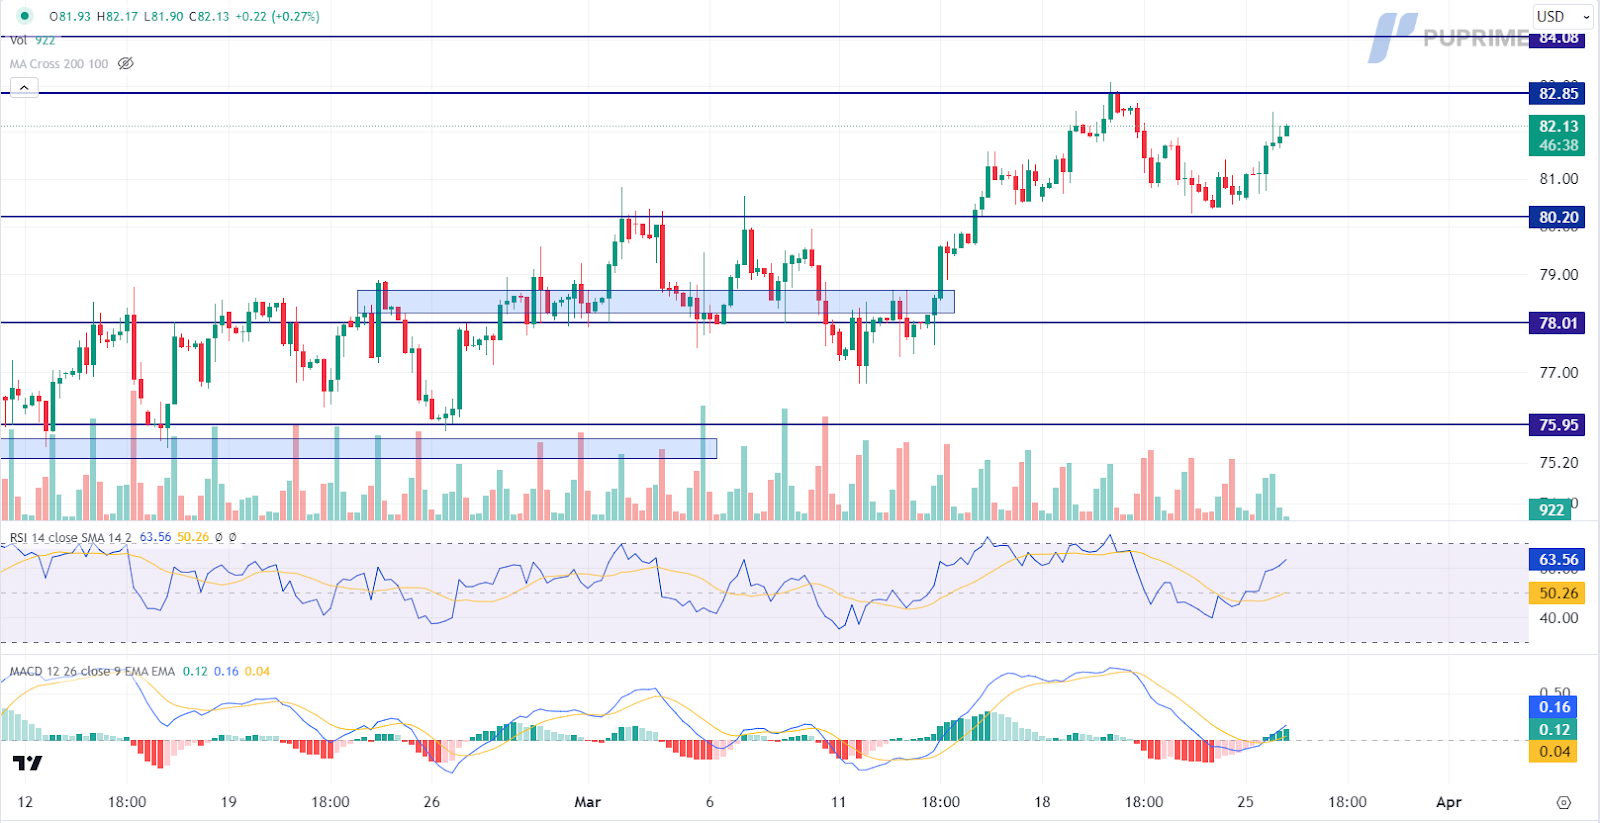
CL OIL, H4
Crude oil prices surged as market sentiment turned bullish on expectations of tighter global crude supplies. Reports of Russia’s decision to slash oil output to comply with OPEC+ quotas, coupled with ongoing tensions in Ukraine targeting Russian refineries, heightened concerns over potential supply disruptions. These developments fueled bullish momentum in oil markets, underscoring the prevailing volatility and uncertainty.
Oil prices are trading higher while currently near the resistance level. MACD has illustrated increasing bullish momentum, while RSI is at 64, suggesting the commodity might extend its gains since the RSI stays above the midline.
Resistance level: 82.85, 84.10
Support level: 80.20, 78.00
Inizia a Fare Trading con un Vantaggio
Scambia forex, indici, Metalli e altro ancora a spread bassi e con un'esecuzione fulminea.
Inizia a fare trading con depositi a partire da $50 sui nostri conti standard.
Ottieni accesso all’assistenza 24/7
Accedi a centinaia di strumenti, a strumenti didattici gratuiti e ad alcune delle migliori promozioni in circolazione.
Please note the Website is intended for individuals residing in jurisdictions where accessing the Website is permitted by law.
Please note that PU Prime and its affiliated entities are neither established nor operating in your home jurisdiction.
By clicking the "Acknowledge" button, you confirm that you are entering this website solely based on your initiative and not as a result of any specific marketing outreach. You wish to obtain information from this website which is provided on reverse solicitation in accordance with the laws of your home jurisdiction.
Ten en cuenta que el sitio web está destinado a personas que residen en jurisdicciones donde el acceso al sitio web está permitido por la ley.
Ten en cuenta que PU Prime y sus entidades afiliadas no están establecidas ni operan en tu jurisdicción de origen.
Al hacer clic en el botón "Aceptar", confirmas que estás ingresando a este sitio web por tu propia iniciativa y no como resultado de ningún esfuerzo de marketing específico. Deseas obtener información de este sitio web que se proporciona mediante solicitud inversa de acuerdo con las leyes de tu jurisdicción de origen.