* The dollar slid after the lower-than-expected PCE reading was released last Friday.
* Keep an eye on today’s UK GDP and its implications for the pound sterling.
* The crypto market is weighing on excessive downside pressure, and both BTC and ETH remain in a bearish trajectory.
Market Summary
The U.S. PCE reading released last Friday missed expectations, shifting market sentiment and introducing uncertainty at the start of the new trading week. The dollar weakened initially but found support, with the dollar index holding above the 107.60 mark.
In contrast, the equity market, encouraged by the low inflation reading, rebounded significantly, and a potential “Santa Claus” rally is expected to buoy the market as it wraps up the year. In the forex market, the Pound Sterling was pressured by weak CPI and Retail Sales data, with the UK GDP set to be released today, providing insight into the strength of the Pound. In the commodity space, gold saw a technical rebound, rising over 1% last Friday, driven by the softer dollar.
Meanwhile, both BTC and ETH remain under significant downside pressure, with market sentiment shaped by expectations of a more hawkish Fed in 2025, dampening risk appetite in the crypto market.
Current rate hike bets on 29th January Fed interest rate decision:
Source: CME Fedwatch Tool
0 bps (91.4%) VS -25 bps (8.6%)
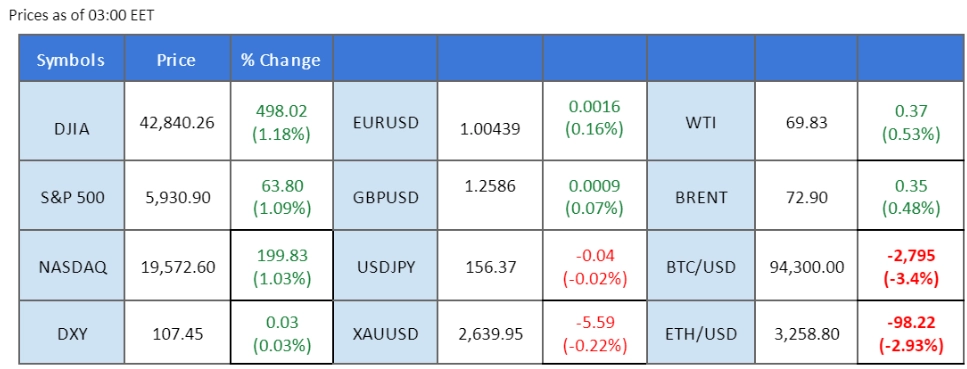
Market Overview
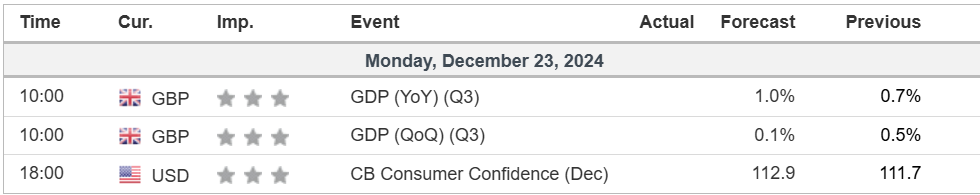
Economic Calendar
(MT4 System Time)
Source: MQL5
Market Movements
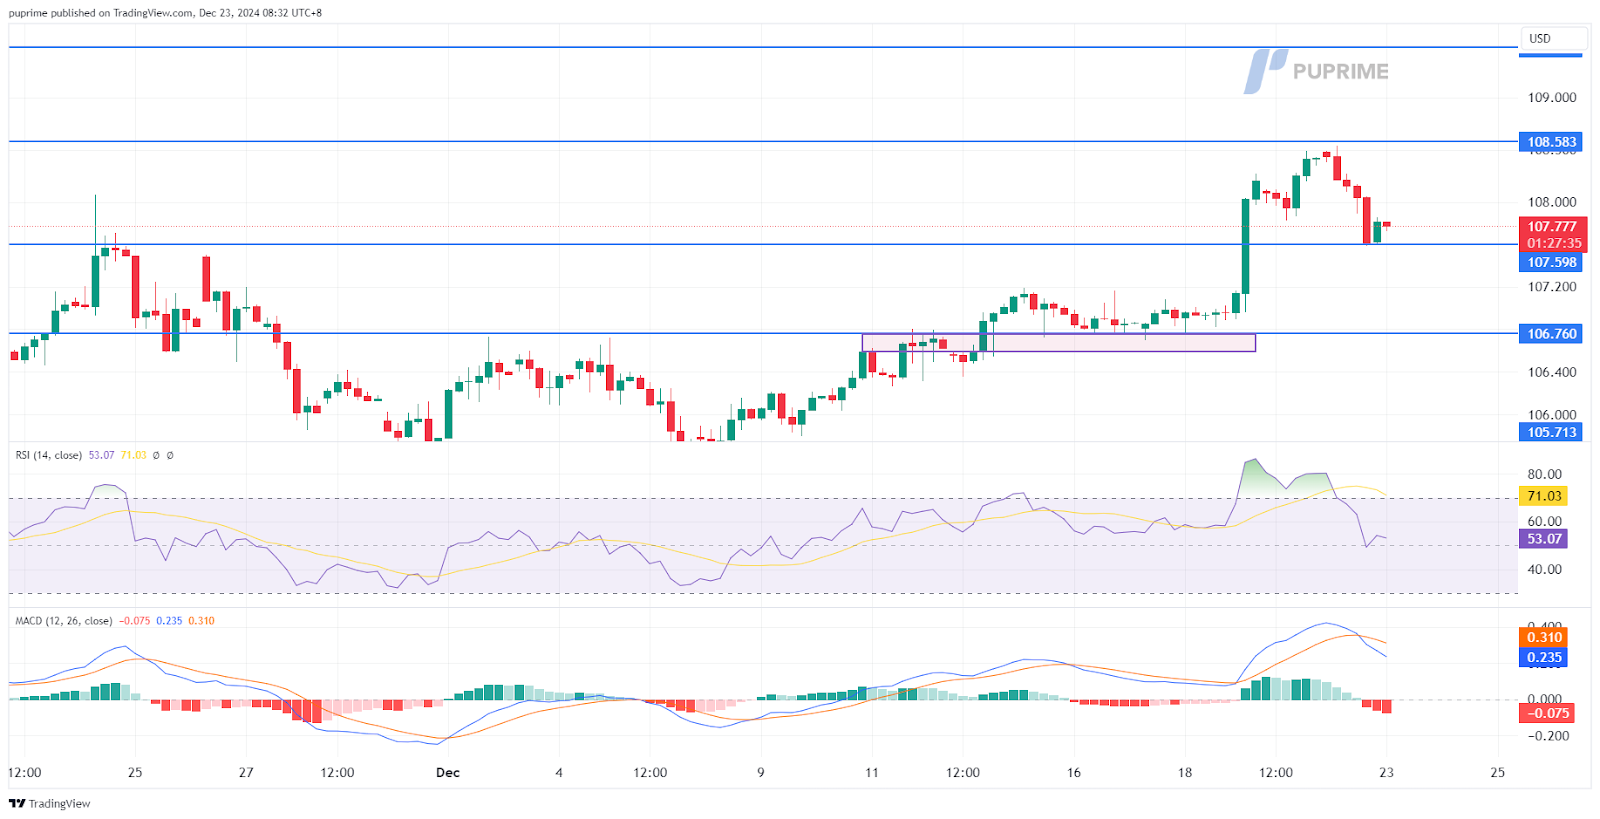
DOLLAR_INDX, H4
The U.S. Dollar faced selling pressure following last Friday’s weaker-than-expected U.S. PCE data, the Fed’s preferred inflation gauge. The dollar index retreated from its two-year high but found support above the 106.60 mark, indicating it remains within a bullish trajectory. Traders now focus on today’s CB Consumer Confidence data, which is anticipated to show improvement and could potentially reignite bullish momentum for the greenback.
The dollar index declined significantly in the last session, breaking below its critical support level at the 106.60 mark, which shall be seen as a bearish signal for the index. The RSI has dropped from the overbought zone while the MACD has a deadly cross on the top, suggesting that the bullish momentum is easing.
Resistance level: 108.60, 109.50
Support level: 106.75, 105.70
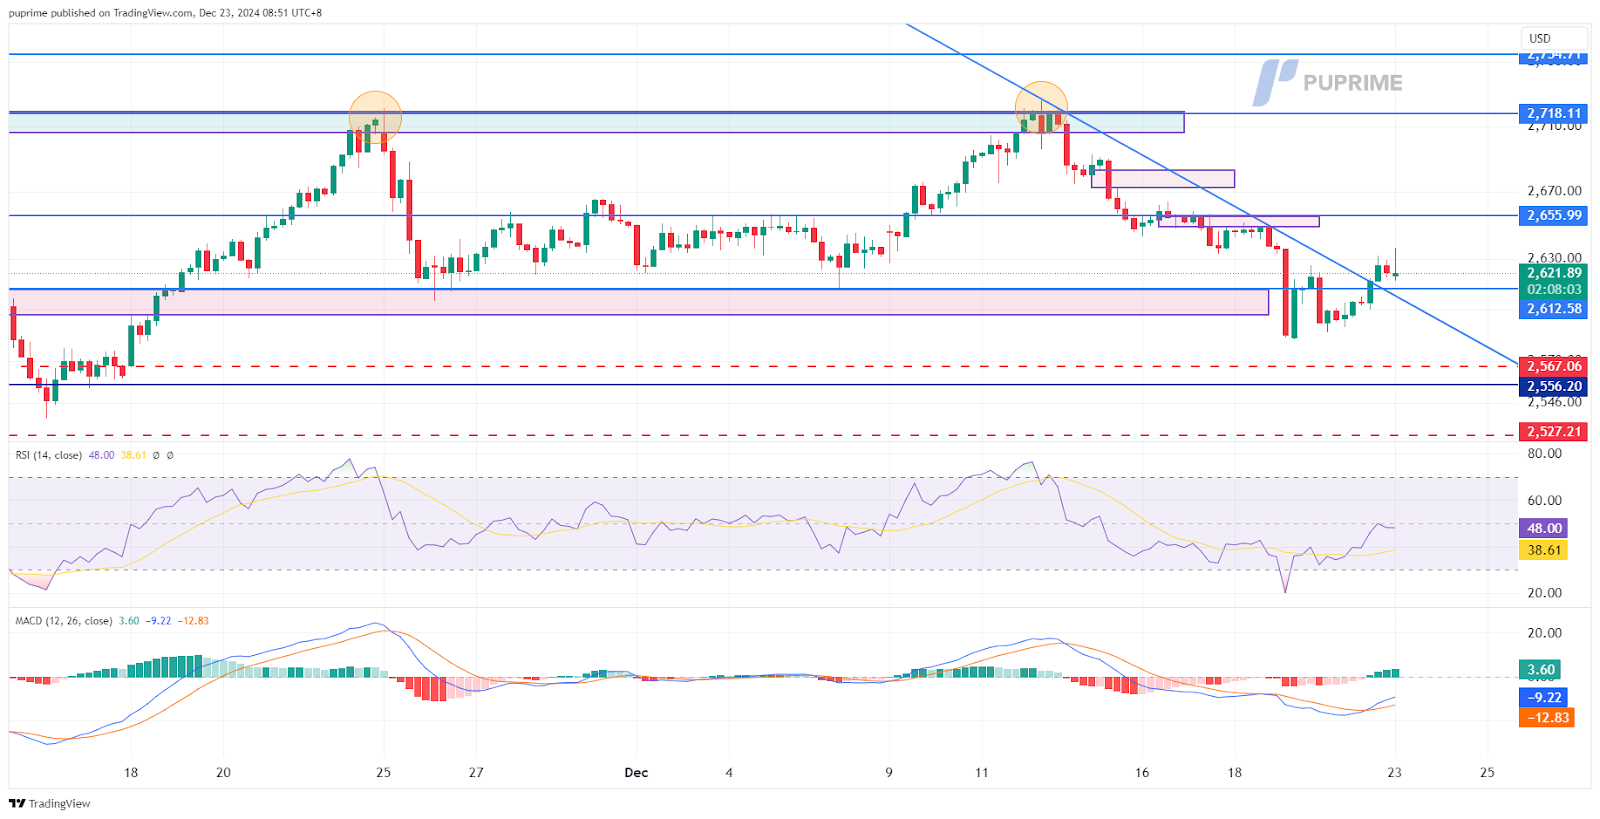
XAU/USD, H4
Gold rebounded from recent lows, gaining over 1% in the last session, signaling a potential trend reversal. The rally was primarily supported by a softer U.S. Dollar, which boosted demand for the precious metal. Breaking above its previous high, gold indicates a possible shift from its prior bearish trajectory, suggesting further upside potential if the bullish momentum sustains.
Gold has risen past the downtrend resistance level, suggesting a potential trend reversal for the gold. The RSI has rebounded from the oversold zone, while the MACD has a golden cross from below, suggesting that the bearish momentum is easing.
Resistance level: 2656.00, 2718.00
Support level: 2556.00, 2485.65
GBP/USD,H4
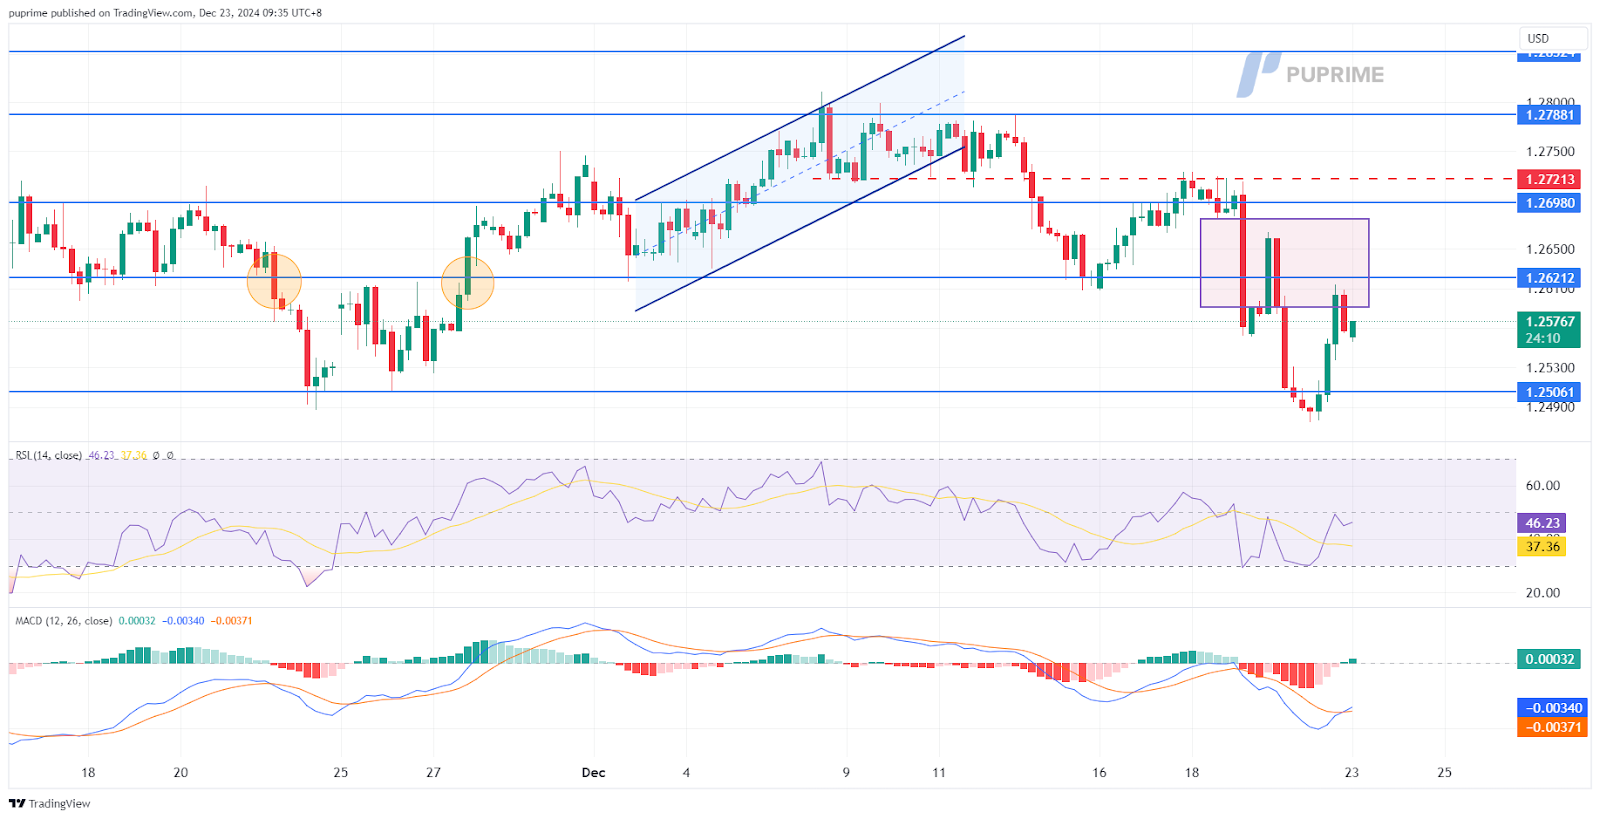
The GBP/USD pair experienced significant volatility, fluctuating nearly 180 pips in the last session due to several factors. Initially, the weaker-than-expected UK Retail Sales data limited the Pound Sterling’s strength. However, the pair later gained momentum as the U.S. Dollar softened, boosting the Cable’s upward movement.
Despite a rebound, the GBP/USD pair remains trading in a lower-high price pattern, suggesting a bearish bias for the pair. The RSI remains below the 50 level while the MACD is edging lower, suggesting that the pair remains trading with bearish momentum.
Resistance level: 1.2620, 1.2700
Support level:1.2506, 1.2410
EUR/USD,H4
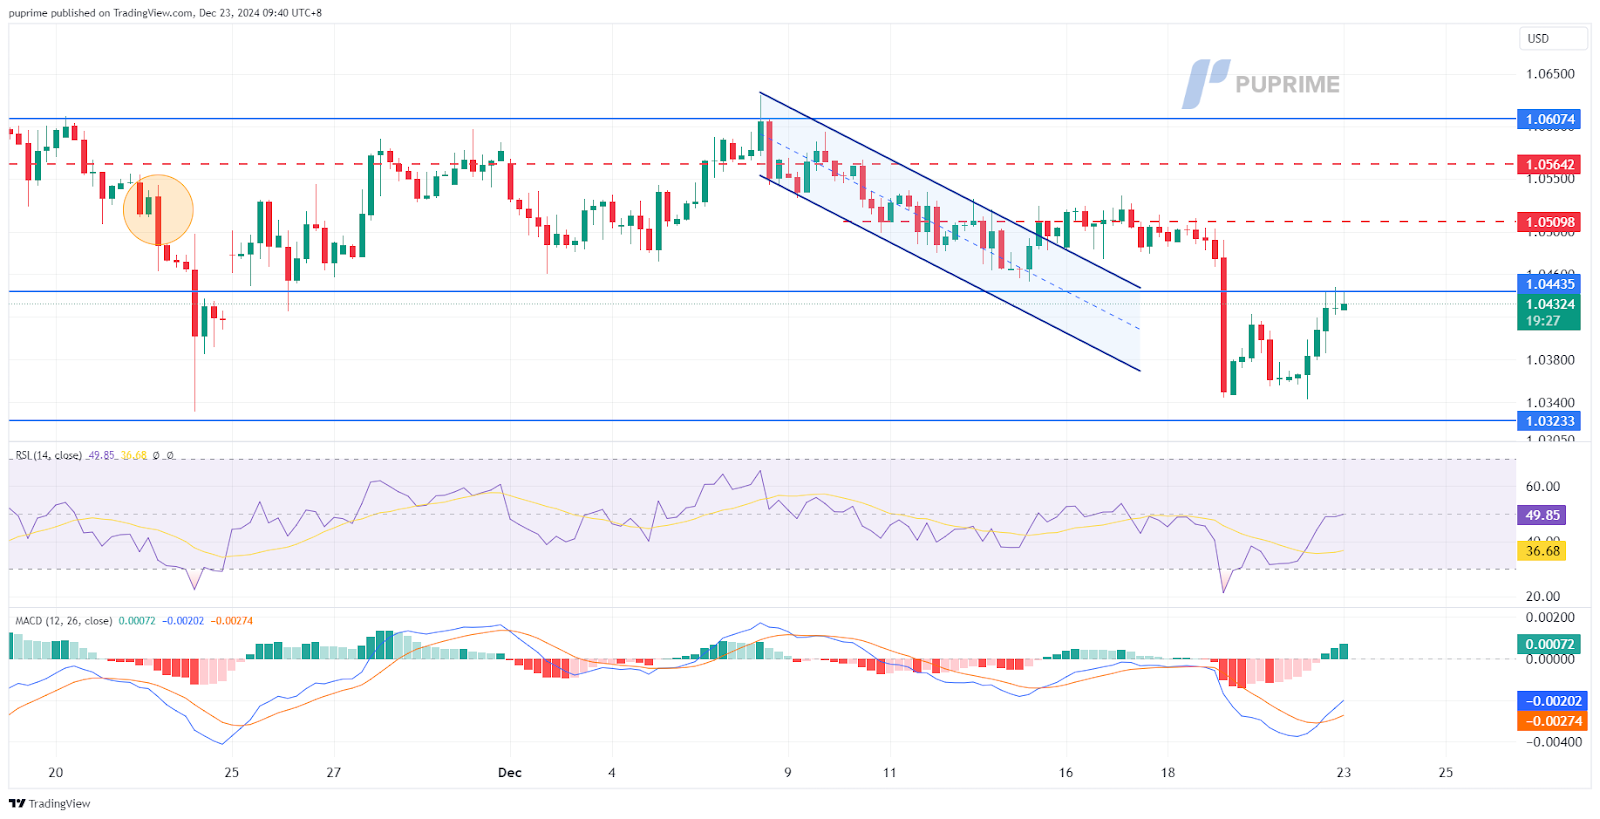
The EUR/USD pair rose above its previous high at the 1.0415 level, signaling a potential trend reversal. A break above the next resistance at 1.0445 would confirm a bullish signal for the pair. However, fundamentally, the ECB is more likely to implement a more aggressive rate cut than the Fed in 2025, which could put additional downside pressure on the pair.
The EUR/USD rose more than 0.7% in the last session, suggesting a potential trend reversal for the pair. The RSI has rebounded, while the MACD has a golden cross below, suggesting that the bearish momentum is vanishing.
Resistance level: 1.0445, 1.0608
Support level: 1.0324, 1.0238
GBP/JPY, H4
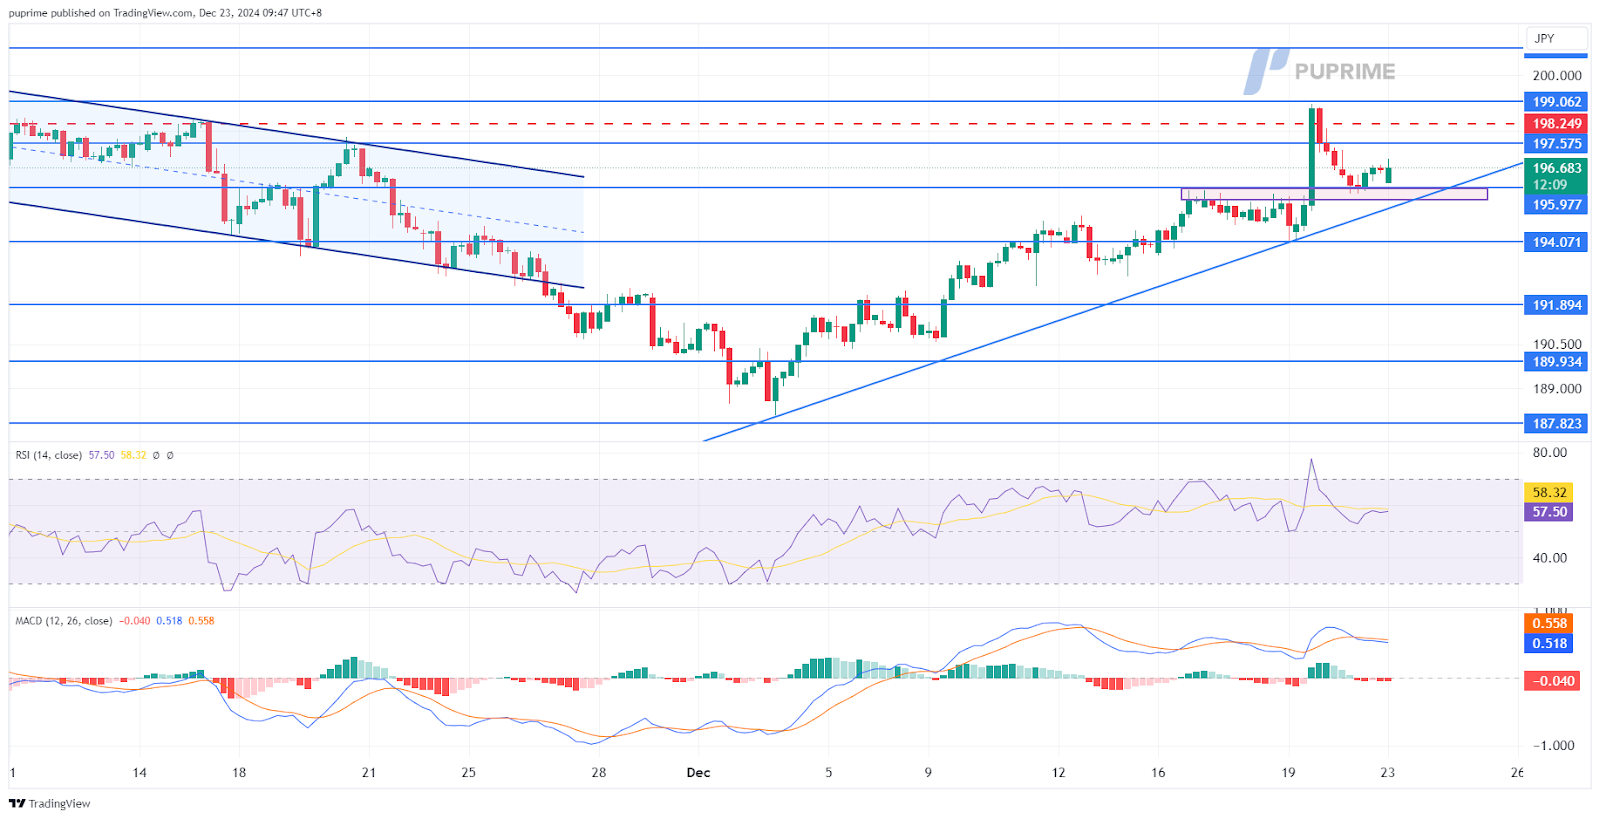
The GBP/JPY pair has dropped nearly 1.5% from its recent peak, indicating a potential trend reversal. The Pound Sterling has weakened due to lower-than-expected CPI and Retail Sales data released last week. Meanwhile, the Japanese Yen gained strength from hawkish comments by the BoJ, suggesting a potential rate hike in early 2025. These factors are expected to exert strong downside pressure on the pair.
The pair slid by more than 1.5% in the recent session; a break below the liquidity zone at near the 195.50 mark shall be a bearish signal for the pair. The RSI remains above the 50 level while the MACD remains elevated, suggesting that the pair remain trading with bullish momentum.
Resistance level:197.60, 199.00
Support level: 195.90, 194.00
Dow Jones, H4
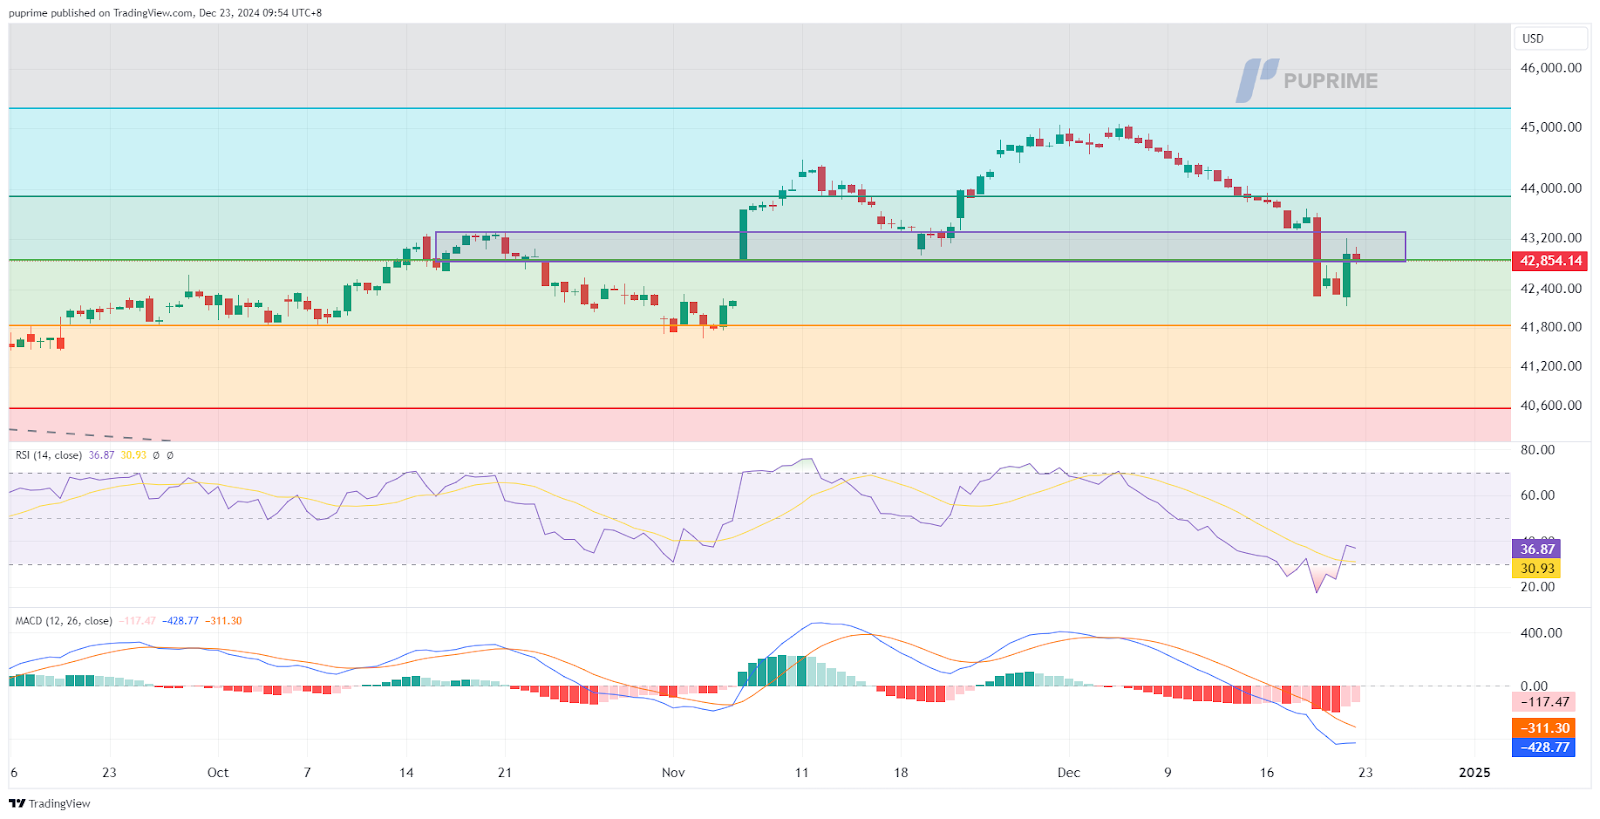
The U.S. equity market, including the Dow, rebounded in the last session, gaining nearly 500 points after weeks of bearish momentum. The Dow has filled the gap formed in November and is showing signs of recovery. If the Dow manages to stay above the immediate support level at 42,850, it could signal a potential trend reversal for the index.
The Dow has ended its 2 weeks straight of losses and recorded a gain in the last session; a break above the 43300 mark shall be a solid trend reversal from the strong bearish trend. The RSI has gotten out from the oversold zone while the MACD continues to edge lower, suggesting that the bearish momentum remains intact with the Dow.
Resistance level: 43,900.00, 45,350.00
Support level:41,840.00, 40,540.00
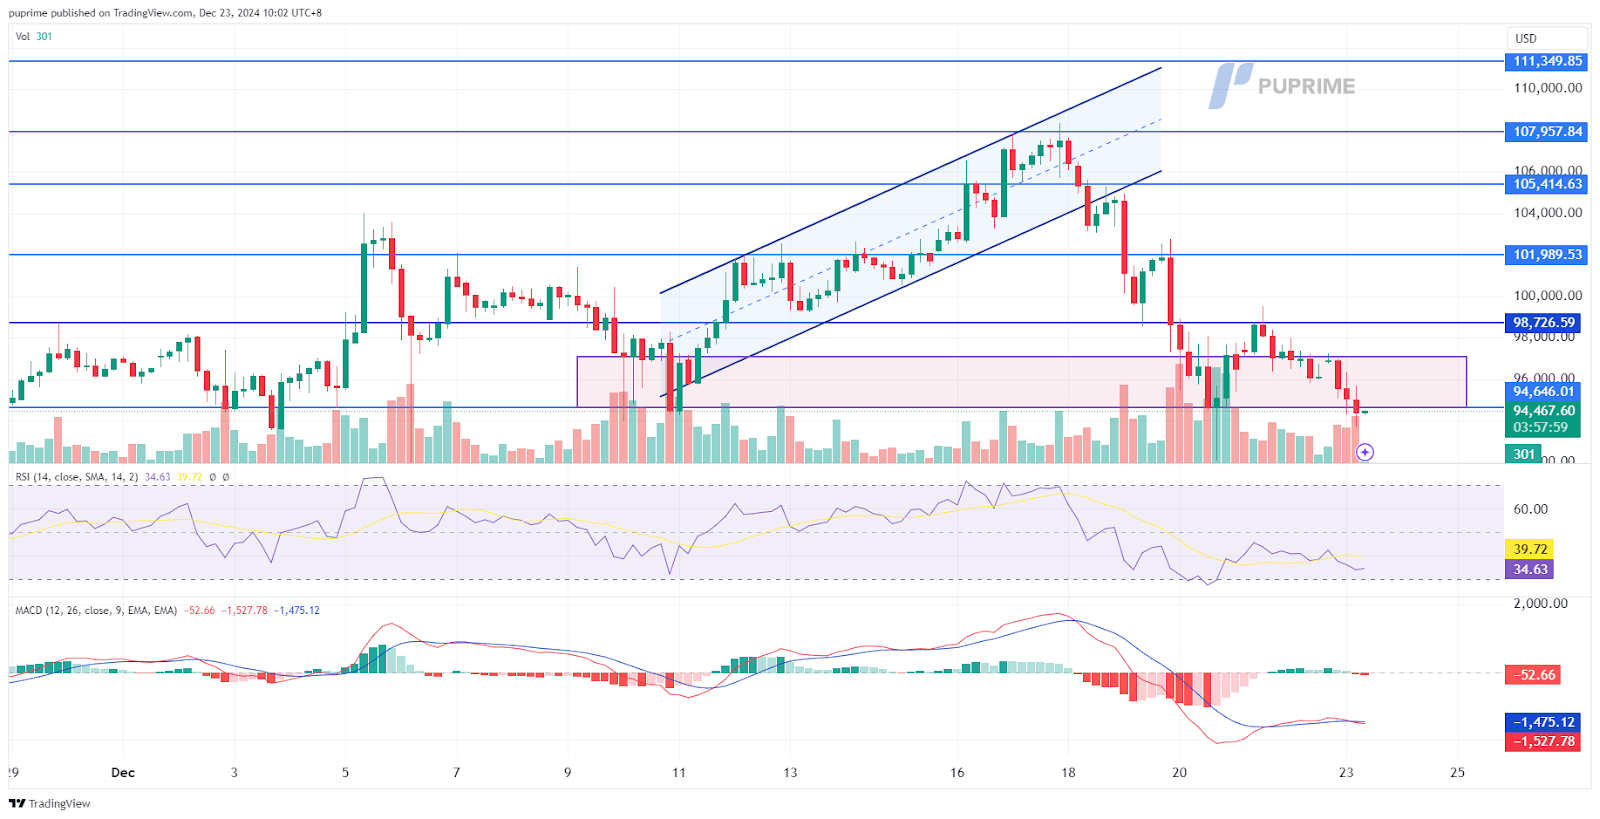
BTC/USD, H4
BTC ended its 7-session winning streak with a significant drop in the last session, primarily driven by U.S. economic indicators that shifted market sentiment. The bearish momentum appears strong, potentially pushing BTC toward its next support level near 91,450. However, the U.S. SEC’s approval of a hybrid BTC-ETH ETF, scheduled for launch in January, could potentially drive BTC prices higher in the future.
BTC is struggling to find support near the 94,650 mark; a break below such a level shall be a bearish signal for BTC. The RSI remains close to the oversold zone while the MACD flows flat at the bottom, suggesting that the bearish momentum remains strong with BTC.
Resistance level: 98,800.00, 101,990.00
Support level: 91,430.00, 87,750.00
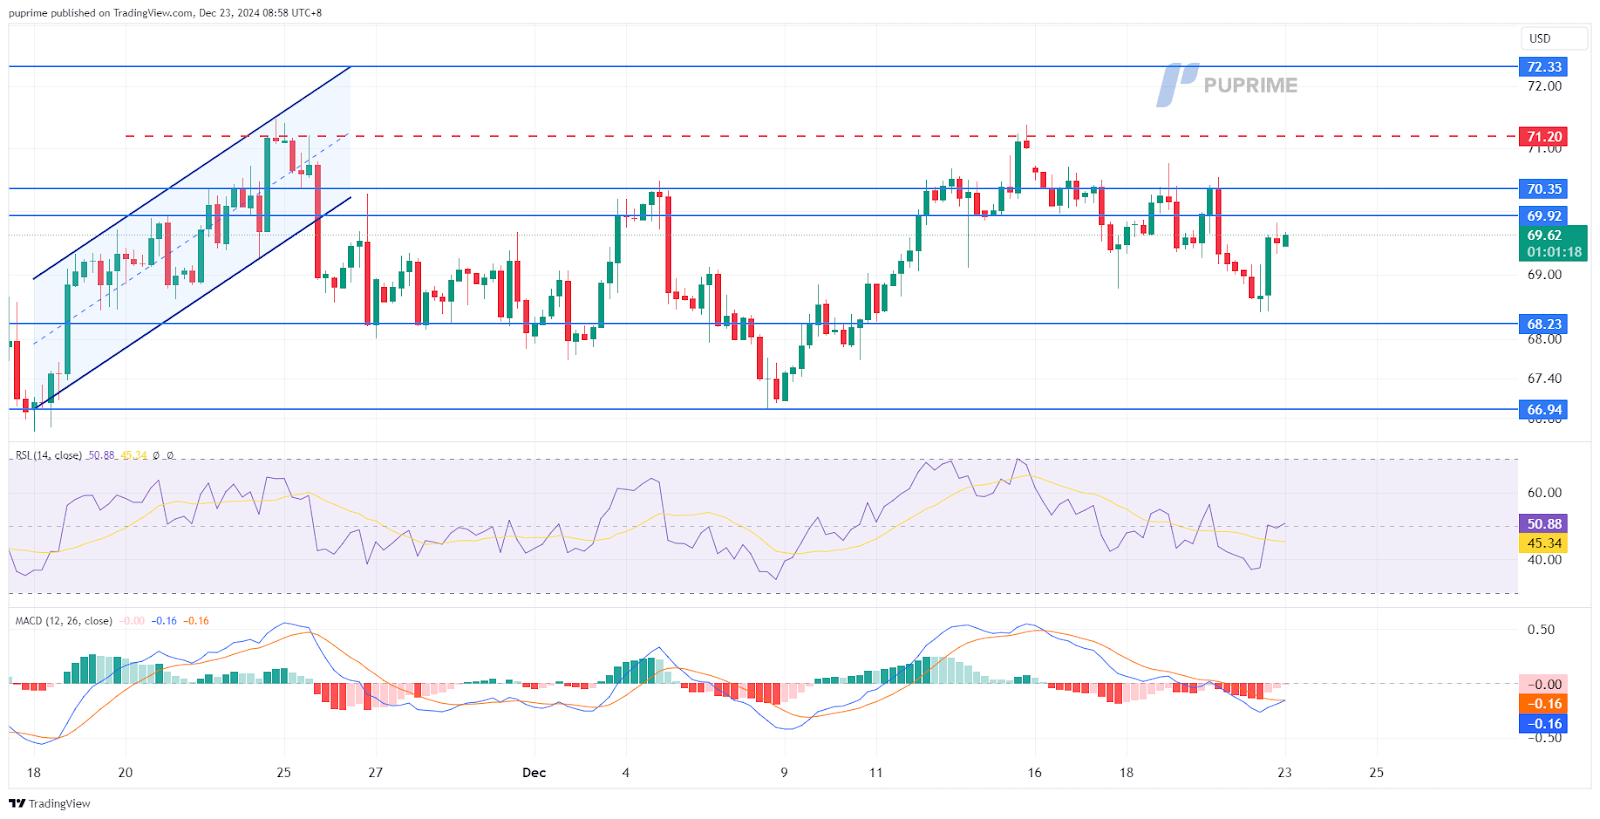
CL OIL, H4
Oil prices rebounded in the last session, supported by a softer U.S. Dollar, recovering earlier losses. However, oil has yet to break above its previous high, indicating it remains in a bearish trajectory. Concerns over weakening demand and a potential increase in supply next year continue to exert downside pressure, limiting any sustained recovery.
Despite a last-minute surge in the last session, the oil remains trading in a lower-low price pattern, suggesting a bearish bias for the oil. The RSI is moving lower while the MACD has broken below from the zero line, suggesting an increase in bearish momentum.
Resistance level: 69.90, 72.30
Support level: 68.25, 67.00
Inizia a Fare Trading con un Vantaggio
Scambia forex, indici, Metalli e altro ancora a spread bassi e con un'esecuzione fulminea.
Inizia a fare trading con depositi a partire da $50 sui nostri conti standard.
Ottieni accesso all’assistenza 24/7
Accedi a centinaia di strumenti, a strumenti didattici gratuiti e ad alcune delle migliori promozioni in circolazione.
Please note the Website is intended for individuals residing in jurisdictions where accessing the Website is permitted by law.
Please note that PU Prime and its affiliated entities are neither established nor operating in your home jurisdiction.
By clicking the "Acknowledge" button, you confirm that you are entering this website solely based on your initiative and not as a result of any specific marketing outreach. You wish to obtain information from this website which is provided on reverse solicitation in accordance with the laws of your home jurisdiction.
Ten en cuenta que el sitio web está destinado a personas que residen en jurisdicciones donde el acceso al sitio web está permitido por la ley.
Ten en cuenta que PU Prime y sus entidades afiliadas no están establecidas ni operan en tu jurisdicción de origen.
Al hacer clic en el botón "Aceptar", confirmas que estás ingresando a este sitio web por tu propia iniciativa y no como resultado de ningún esfuerzo de marketing específico. Deseas obtener información de este sitio web que se proporciona mediante solicitud inversa de acuerdo con las leyes de tu jurisdicción de origen.