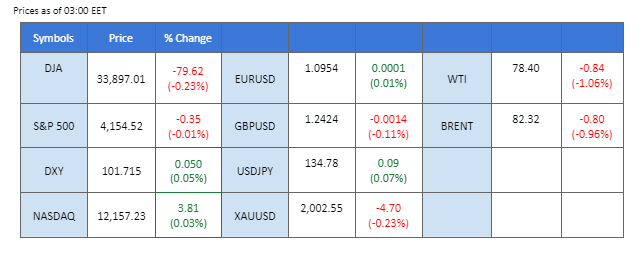
The VIX dipped to its lowest level in over a year as equities trade sideways ahead of the Fed interest rate decision
Asian shares traded lower, and U.S. equity futures fell as investors remained cautious after Wall Street closed with little change. The CBOE VIX volatility index hit its lowest level in over a year. The Bank of America’s global measure of volatility across various asset classes hit its lowest level since early 2022. Inflation data in New Zealand came in softer than anticipated, leading to falling bond yields and currency. Taiwan Semiconductor Manufacturing Co. earnings will be in focus, while Bank of Japan officials are reportedly wary of changing the yield curve control program. The U.S. Federal Reserve reported the economy as “little changed” but with signs of slowing, with bets still leaning towards a rate hike next month.
Current rate hike bets on 3rd May Fed interest rate decision:
Source: CME Fedwatch Tool
25 bps (16.3%) VS 50 bps (83.7%)
Market Overview
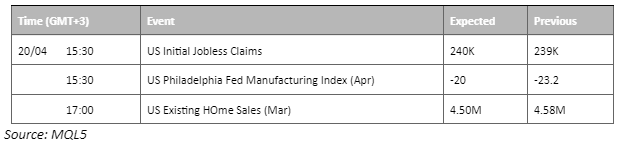
Economic Calendar
Market Movements
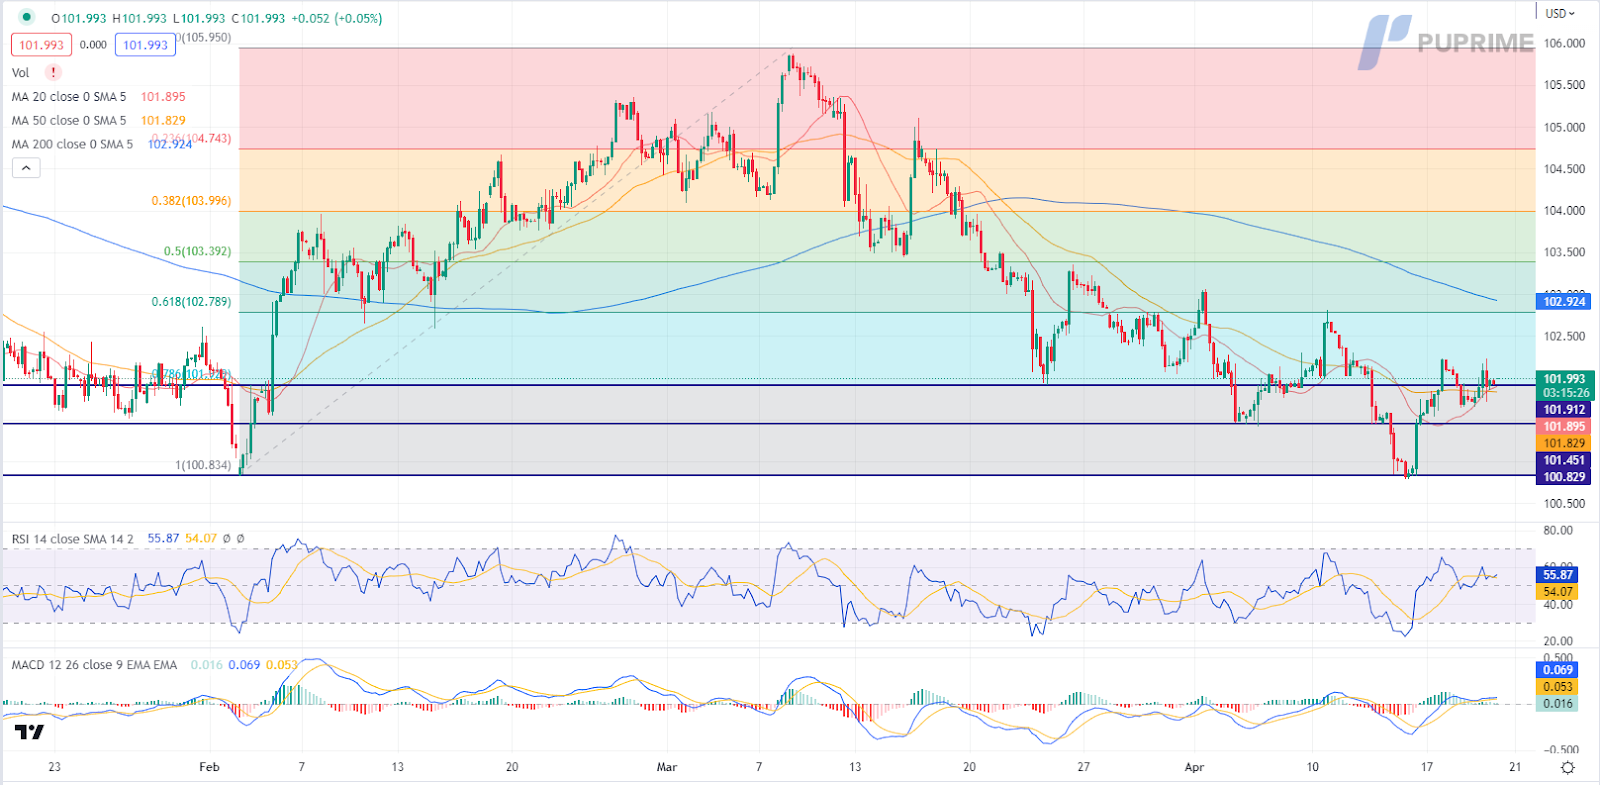
DOLLAR_INDX,H4
The US Dollar has gained strength, bolstered by a surge in Treasury yields as market participants anticipate the possibility of the Federal Reserve continuing to tighten their monetary policy, despite the easing of inflation risks. The yield on two-year Treasury bonds, known for their sensitivity to expectations regarding the US central bank’s monetary policy, has risen to 4.269% as of writing, nearing a one-month high. According to CME’s FedWatch Tool, investors are pricing in an 85.70% probability that the Fed will increase interest rates by 25 basis points during the policymakers’ two-day meeting on 3rd May.
The Dollar Index is trading flat while currently testing the support level at 101.90. MACD has illustrated increasing bullish momentum, while RSI is at 56, suggesting the index might be traded higher as the RSI stays above the midline.
Resistance level: 102.80, 103.40
Support level: 101.90, 101.45
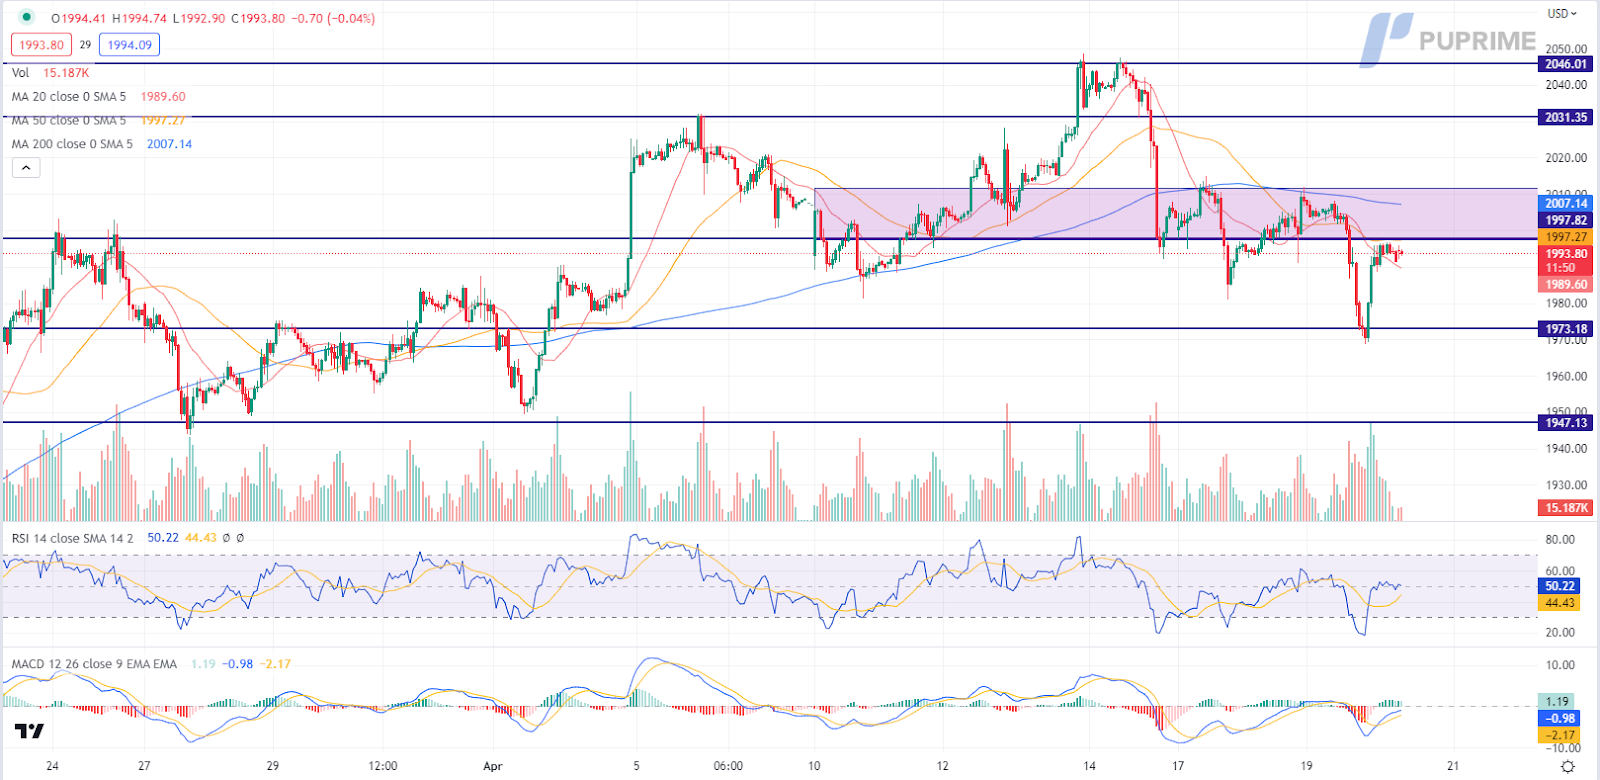
XAU/USD, H1
In a tumultuous trading session, gold prices initially plummeted in response to a surge in Treasury yields fuelled by the anticipation of the Federal Reserve’s potential tightening of their monetary policy. Despite easing inflation risks, market participants were bracing themselves for a potential shift in policy stance. The yield on two-year Treasury bonds, renowned for their sensitivity to the US central bank’s monetary policy expectations, soared to 4.269%, approaching a one-month high. However, the precious metal managed to stage a comeback later in the day, thanks to profit-taking by short-sellers after hitting a critical support level.
Gold prices are trading higher while currently testing the crucial resistance level at 2000.00. MACD has illustrated increasing bullish momentum, while RSI is at 50, suggesting the commodity is indicating a neutral momentum.
Resistance level: 2000.00, 2030.00
Support level: 1975.00, 1945.00
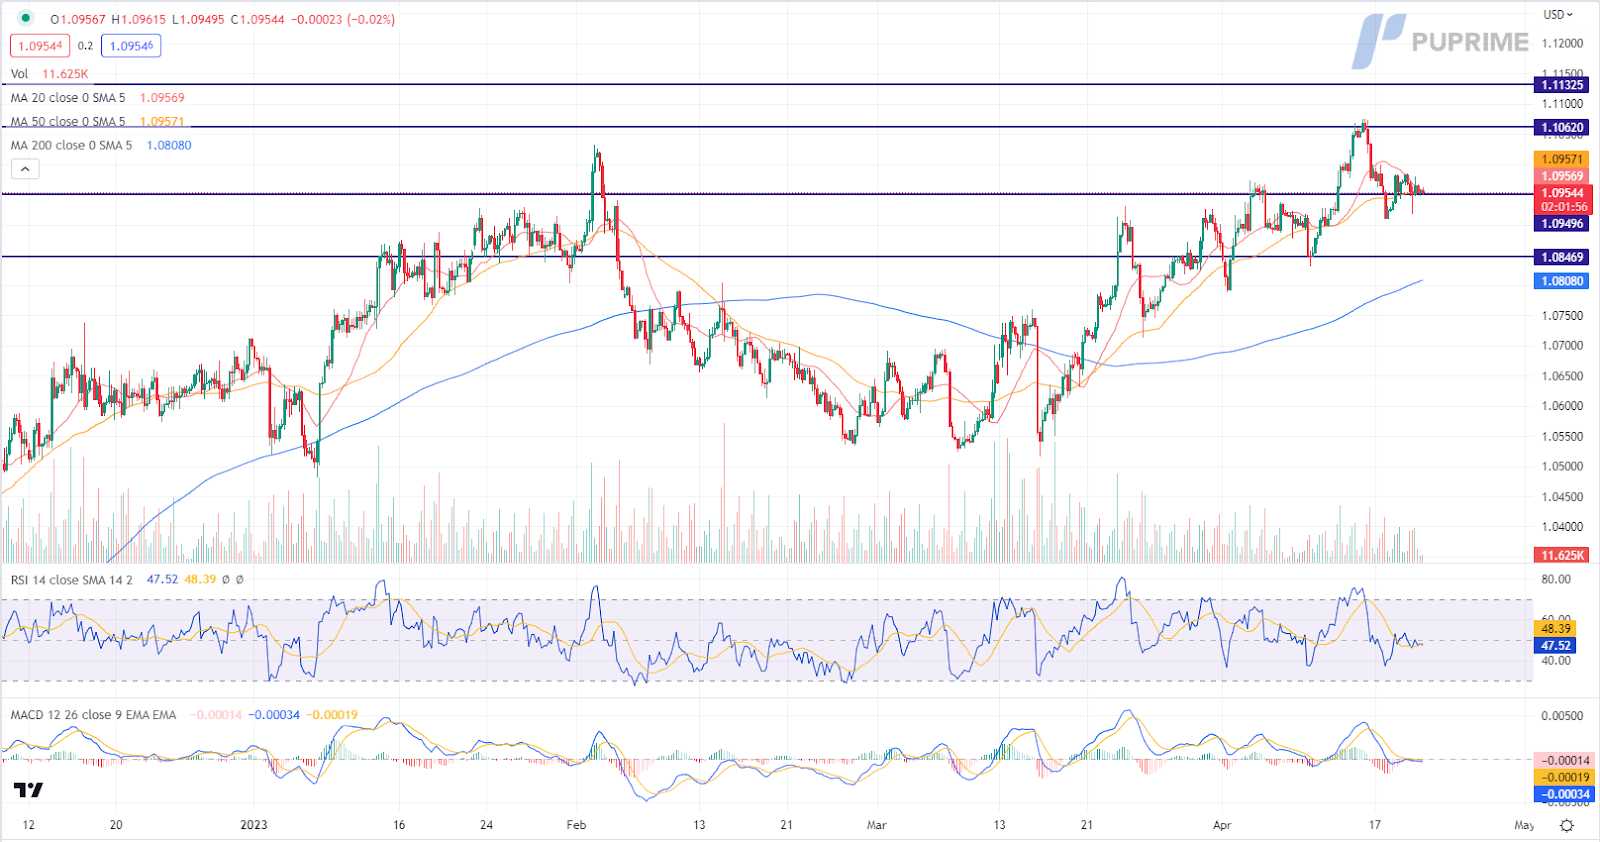
EUR/USD,H4
EUR/USD has retreated from its resistance level, weighed by a resurgence in the US Dollar as investors’ expectations of a more aggressive monetary policy by the Federal Reserve to counter the surging inflation rates. Notably, the US Treasury yields have climbed higher, further bolstering the US Dollar. However, the losses in the EUR/USD pair have been limited, following the release of the latest EU CPI reports by Eurostat. The reports indicate that while Eurozone inflation eased last month, underlying readings have remained persistently high. The confirmation of preliminary data has raised the likelihood of rate hike decisions from the European Central Bank (ECB).
EUR/USD is trading lower while currently testing the support level. MACD has illustrated increasing bearish momentum, while RSI is at 47, suggesting the pair might extend its losses since the RSI stays below the midline.
Resistance level: 1.1060, 1.1135
Support level: 1.0950, 1.0845
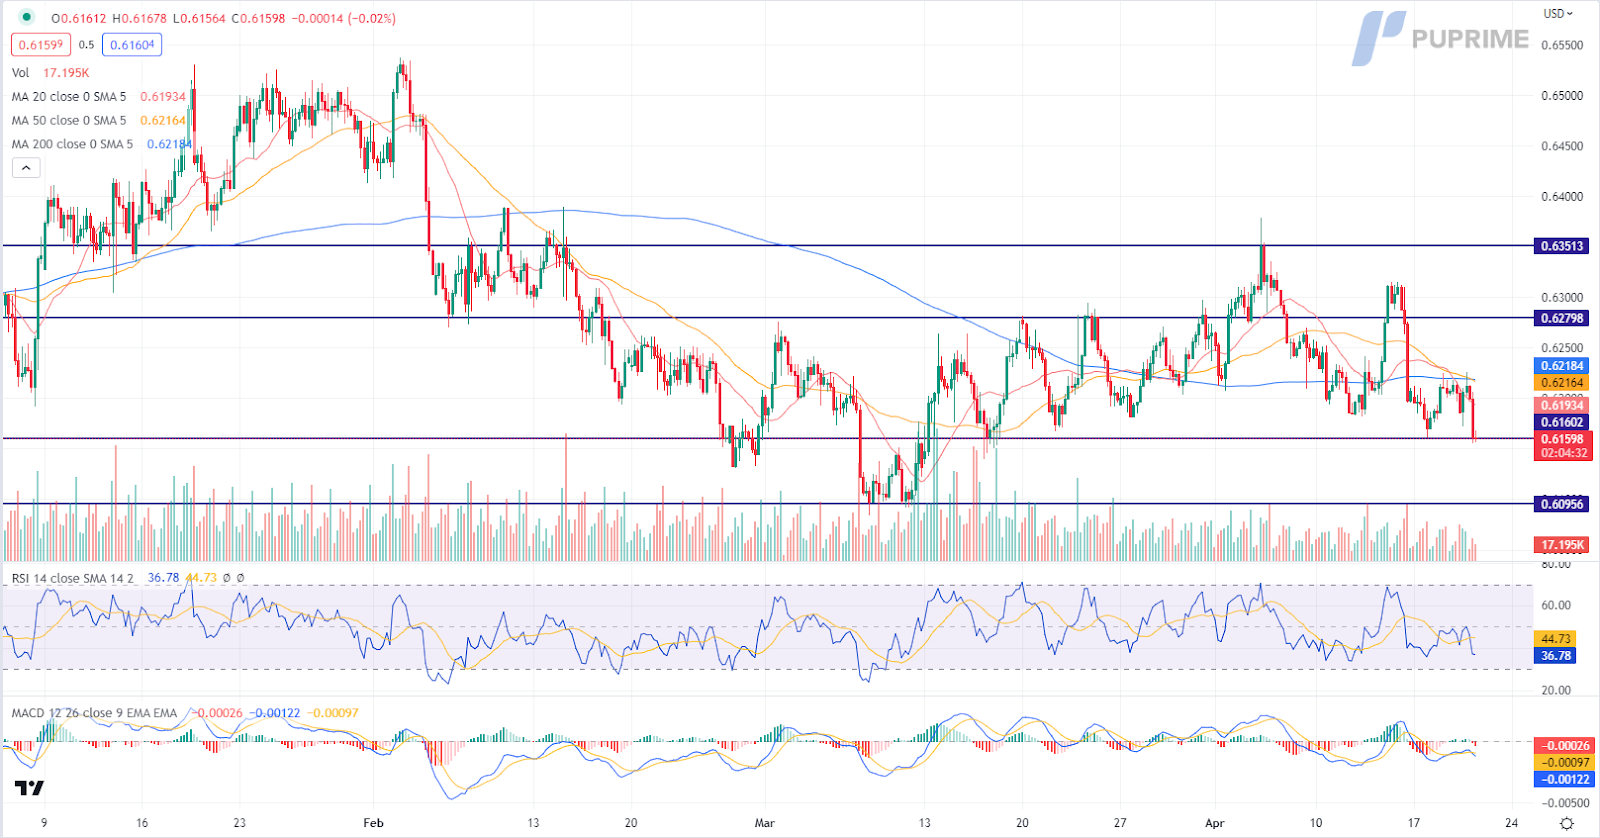
NZDUSD,H4
The Kiwi has taken a hit following the release of CPI data that indicates a significant easing of New Zealand’s inflation rate, thanks to the Reserve Bank of New Zealand’s tightening monetary policy decision. According to Statistics New Zealand, the Consumer Price Index (CPI) from the New Zealand region came in at 1.20%, much lower than market expectations of 1.70%.
NZDUSD is trading lower while currently testing the support level. MACD has illustrated increasing bearish momentum, while RSI is at 37, suggesting the pair might extend its losses after it successfully breakout below the support level.
Resistance level: 0.6280, 0.6350
Support level: 0.6160, 0.6095
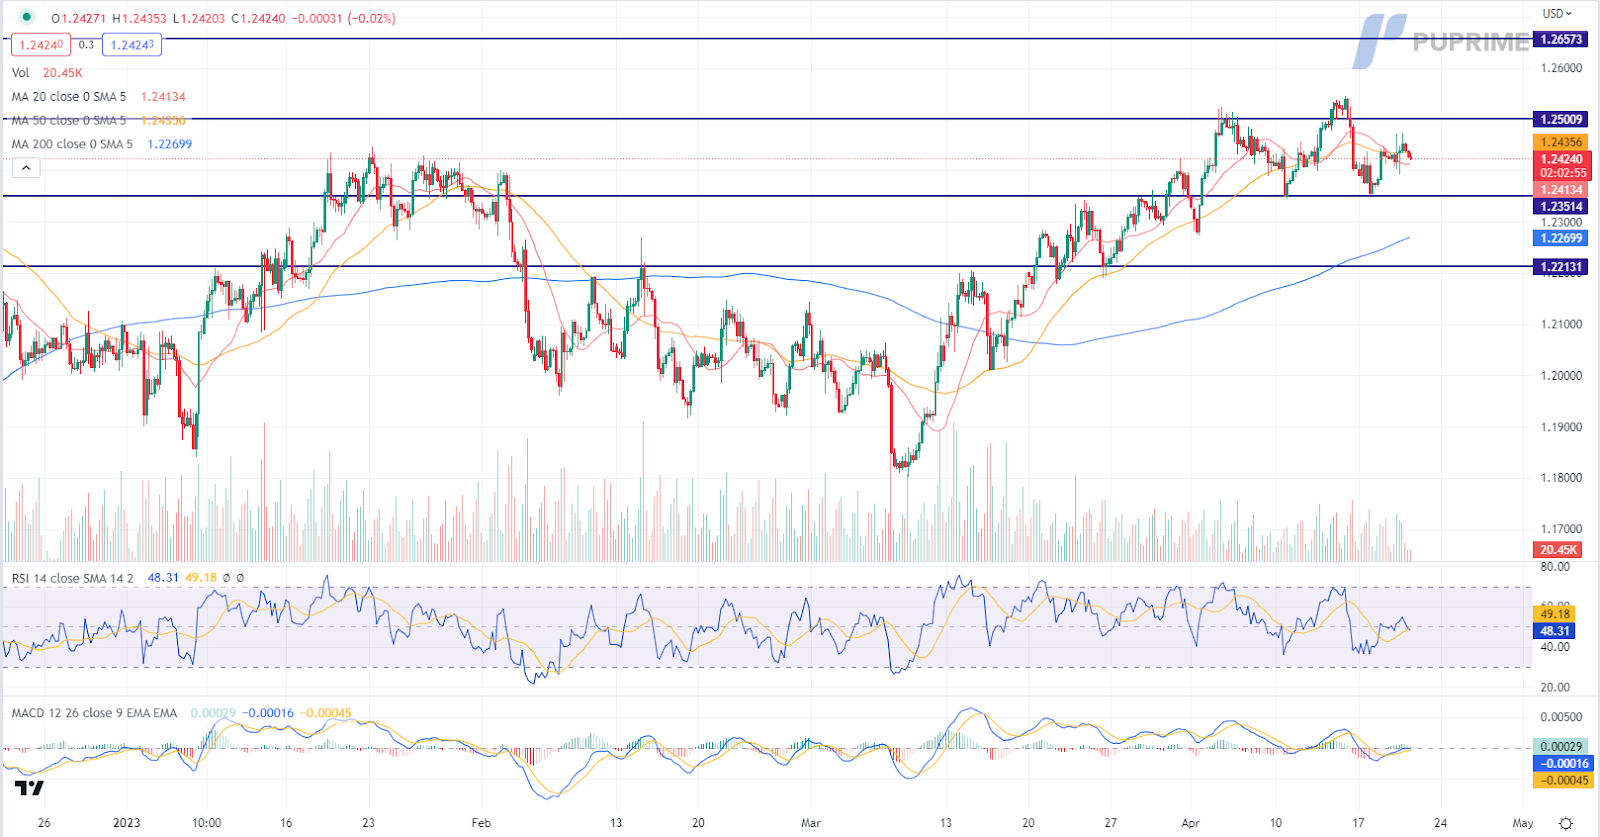
GBP/USD, H4
The Pound Sterling received bullish momentum, bolstered by upbeat economic data. According to the Office for National Statistics, the UK Consumer Price Index (CPI) has come in at 10.1%, much higher than market expectations of 9.80%, signifying that the UK has the highest rate of consumer inflation in Western Europe. This development has increased the odds for the Bank of England to continue their path of rate hikes to combat the spiking inflation rate.
GBP/USD is trading higher following the prior rebound from the support level. However, MACD has illustrated diminishing bullish momentum, while RSI is at 48, suggesting the pair might be traded lower as technical correction since the RSI stays below the midline.
Resistance level: 1.2500, 1.2655
Support level: 1.2350,1.2215
Dow Jones, H4
The Dow Jones Industrial Average dropped 0.23% to close at 33,897.0 as investors analyzed a mixed batch of corporate earnings. While medical technology companies reported positive results, weakness in Netflix shares pulled down the overall performance. Walt Disney Co and UnitedHealth Group Inc also experienced declines due to underwhelming results from industry competitors. The Q1 earnings season is anticipated to yield lacklustre results, and major equity indexes have remained relatively steady.
The Dow Jones index remains hovered near the resistance level of 34263 points, and traders are advised to monitor for potential breakouts. MACD indicates the index remains trading in bullish momentum. RSI is at 61, also indicating a bullish momentum ahead.
Resistance level: 34265, 35770
Support level: 32650, 31435
CL OIL, H4
The strong US Dollar continues to pose a challenge for oil prices, which saw a decline of about 2% to hit a two-week low on Wednesday, despite a sharp decline in US crude inventories. This is because a stronger US Dollar can adversely impact global demand for oil by making it more expensive in other countries. In terms of oil supply, analysts have predicted that oil supply from Russia’s western ports in April is set to rise to its highest level since 2019, surpassing 2.4 million barrels per day, despite Moscow’s pledge to reduce output. This development could put additional downward pressure on oil prices.
Oil prices are trading lower following the prior breakout below the previous support level. MACD has illustrated increasing bearish momentum, while RSI is at 34, suggesting the commodity might extend its losses since the RSI stays below the midline.
Resistance level: 79.65, 80.90
Support level: 77.40, 74.60
Inizia a Fare Trading con un Vantaggio
Scambia forex, indici, Metalli e altro ancora a spread bassi e con un'esecuzione fulminea.
Inizia a fare trading con depositi a partire da $50 sui nostri conti standard.
Ottieni accesso all’assistenza 24/7
Accedi a centinaia di strumenti, a strumenti didattici gratuiti e ad alcune delle migliori promozioni in circolazione.
Please note the Website is intended for individuals residing in jurisdictions where accessing the Website is permitted by law.
Please note that PU Prime and its affiliated entities are neither established nor operating in your home jurisdiction.
By clicking the "Acknowledge" button, you confirm that you are entering this website solely based on your initiative and not as a result of any specific marketing outreach. You wish to obtain information from this website which is provided on reverse solicitation in accordance with the laws of your home jurisdiction.
Ten en cuenta que el sitio web está destinado a personas que residen en jurisdicciones donde el acceso al sitio web está permitido por la ley.
Ten en cuenta que PU Prime y sus entidades afiliadas no están establecidas ni operan en tu jurisdicción de origen.
Al hacer clic en el botón "Aceptar", confirmas que estás ingresando a este sitio web por tu propia iniciativa y no como resultado de ningún esfuerzo de marketing específico. Deseas obtener información de este sitio web que se proporciona mediante solicitud inversa de acuerdo con las leyes de tu jurisdicción de origen.