Market risk appetite improved following the release of U.S. Producer Price Index (PPI) data, which came in lower than expected at 0.1%, below both the market consensus and the previous reading. This softer inflation figure suggests that inflationary pressures in the U.S. may be easing, prompting markets to increase their expectations for a more aggressive Federal Reserve rate cut in September. The CME FedWatch tool now shows a more than 50% probability of a 50 basis point cut, leading to a weakening of the U.S. dollar as traders await today’s Consumer Price Index (CPI) report to further assess the inflation landscape. Wall Street rallied on the soft PPI reading in the last session and the sentiment is shared in the Asian equity markets on Wednesday.
Meanwhile, the Reserve Bank of New Zealand unexpectedly cut its benchmark interest rate by 25 basis points, sending the New Zealand dollar sharply lower during the Asian session. Traders are also closely monitoring the British pound and the euro, both of which have shown strength in recent sessions. Key economic indicators, including the U.K. CPI and Eurozone GDP readings could serve as catalysts for continued rallies in these currencies.
In commodities, safe-haven gold is inching closer to it’s all-time high, buoyed by geopolitical tensions in the Middle East and Europe, coupled with the weakening U.S. dollar. Oil prices are also supported by Middle East tensions and the growing prospect of monetary easing from major central banks.
Le attuali scommesse sul rialzo dei tassi 18 settembre Decisione sui tassi di interesse della Fed:
Fonte: Strumento Fedwatch del CME
0 bps (88,5%) VS -25 bps (11,5%)
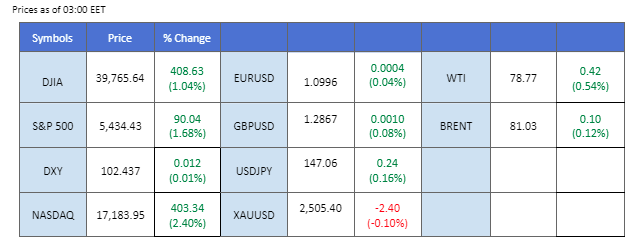
Panoramica del mercato
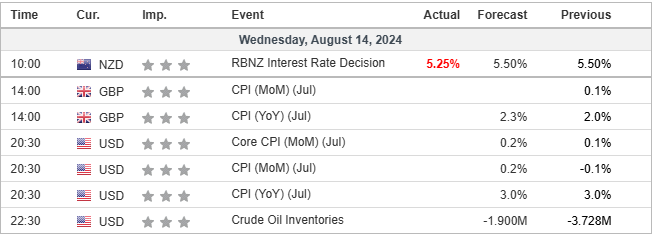
Calendario economico
(Tempo del sistema MT4)
Fonte: MQL5
Movimenti di mercato
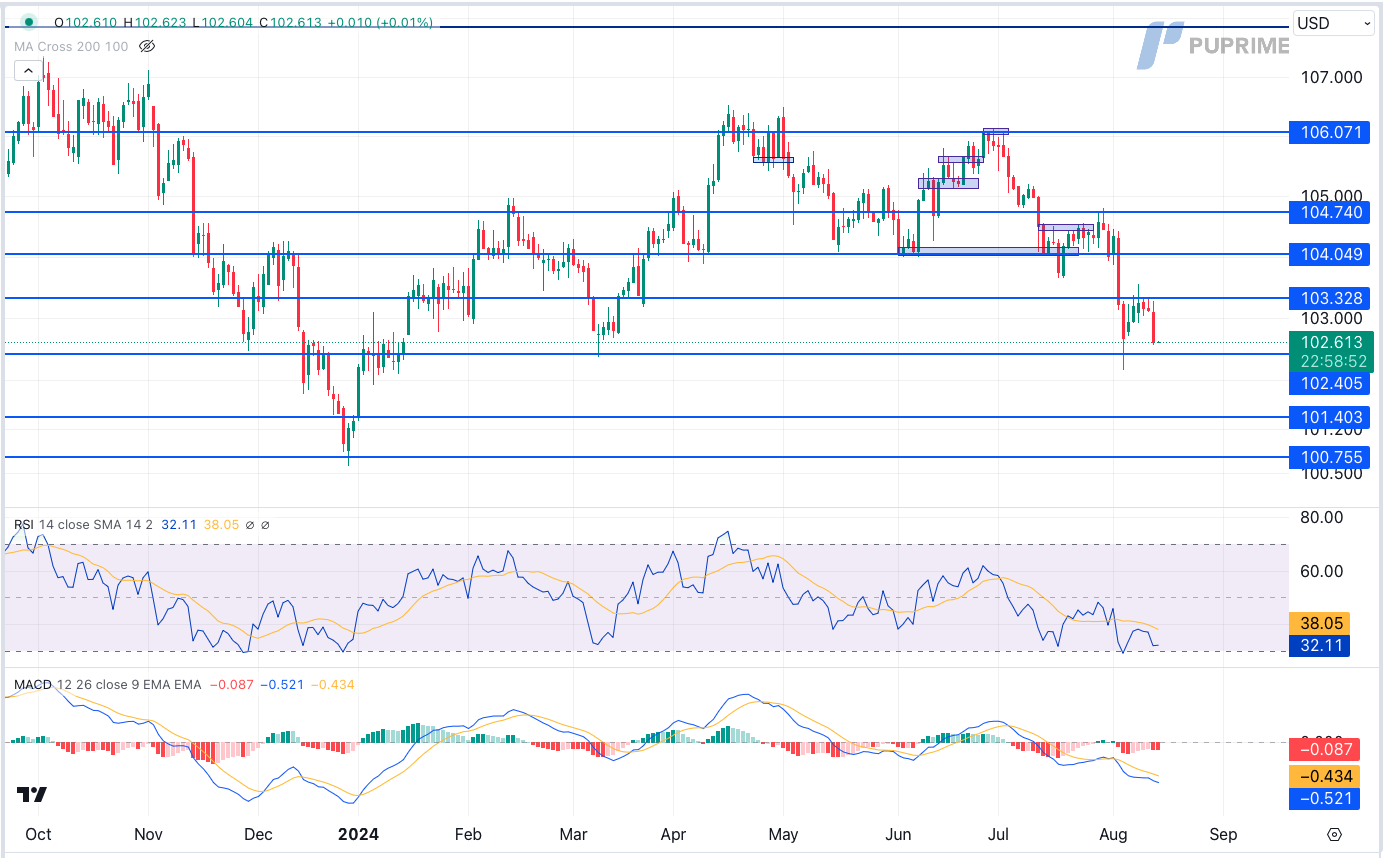
DOLLARO_INDICE, H4
The Dollar Index extended its losses following a downbeat inflation report, which has fueled expectations for the Federal Reserve to continue cutting interest rates aggressively at its September meeting. The US Producer Price Index (PPI) for last month dropped to 0.10%, below both the previous reading of 0.2% and market expectations of 0.20%. This cooler-than-expected PPI has increased the likelihood of rate cuts and set the stage for the upcoming Consumer Price Index (CPI) data.
The Dollar Index is trading lower while currently testing the support level. MACD has illustrated increasing bearish momentum, while RSI is at 32, suggesting the index might extend its losses after breakout since the RSI stays below the midline.
Livello di resistenza: 103,35, 104,05
Livello di supporto: 102.40, 101.40
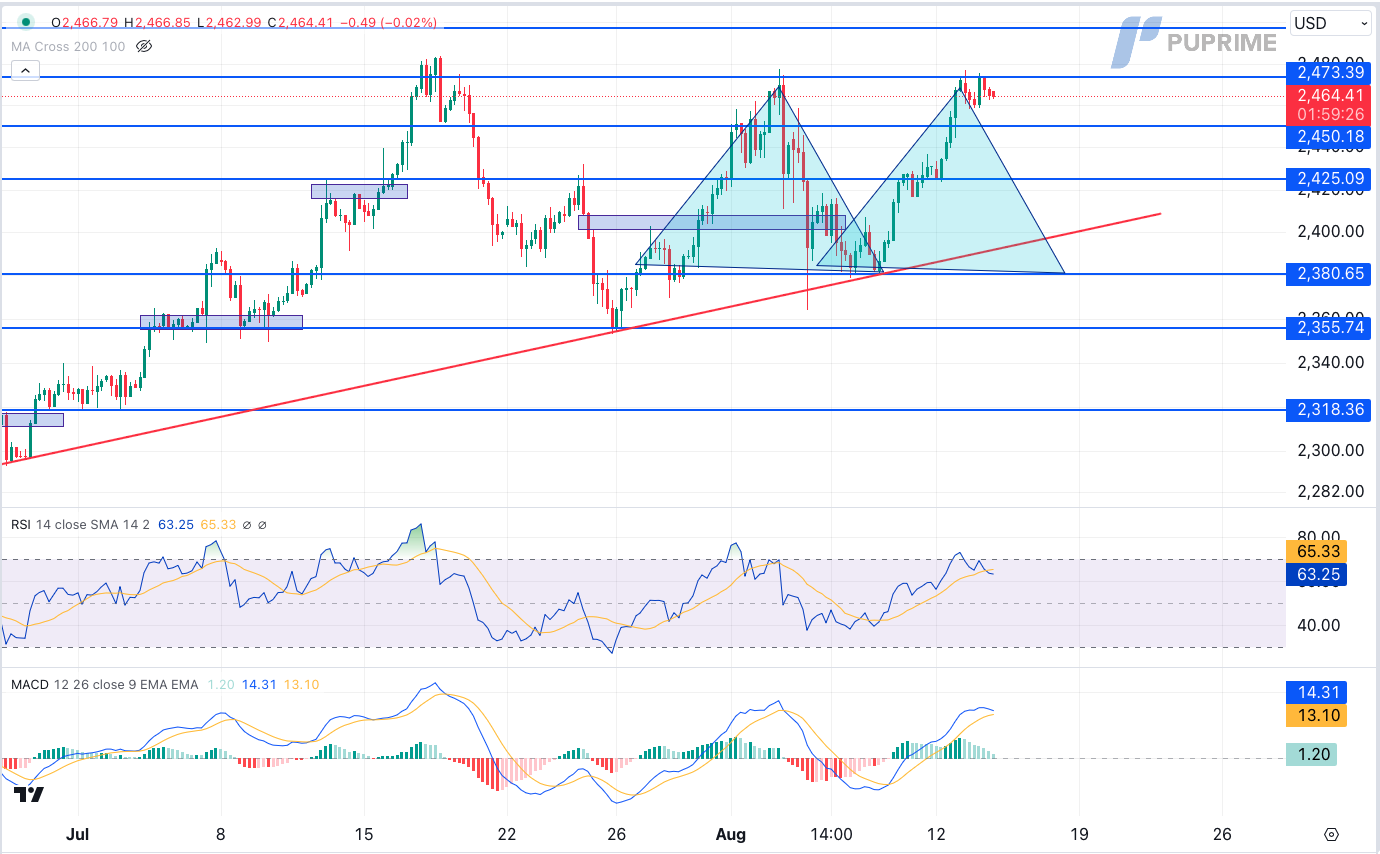
XAU/USD, H4
Gold prices initially rebounded after the downbeat inflation report, attracting investors seeking safe-haven assets. However, gold prices retraced from record high resistance levels due to profit-taking. Investors are advised to focus on the upcoming US CPI data for further trading signals.
Gold prices are trading flat while currently testing the resistance level. However, MACD has illustrated diminishing bullish momentum, while RSI is at 63, suggesting the commodity might edge lower since the RSI retreated sharply from overbought territory.
Resistance level: 2475.00, 2485.00
Support level: 2450.00, 2425.00
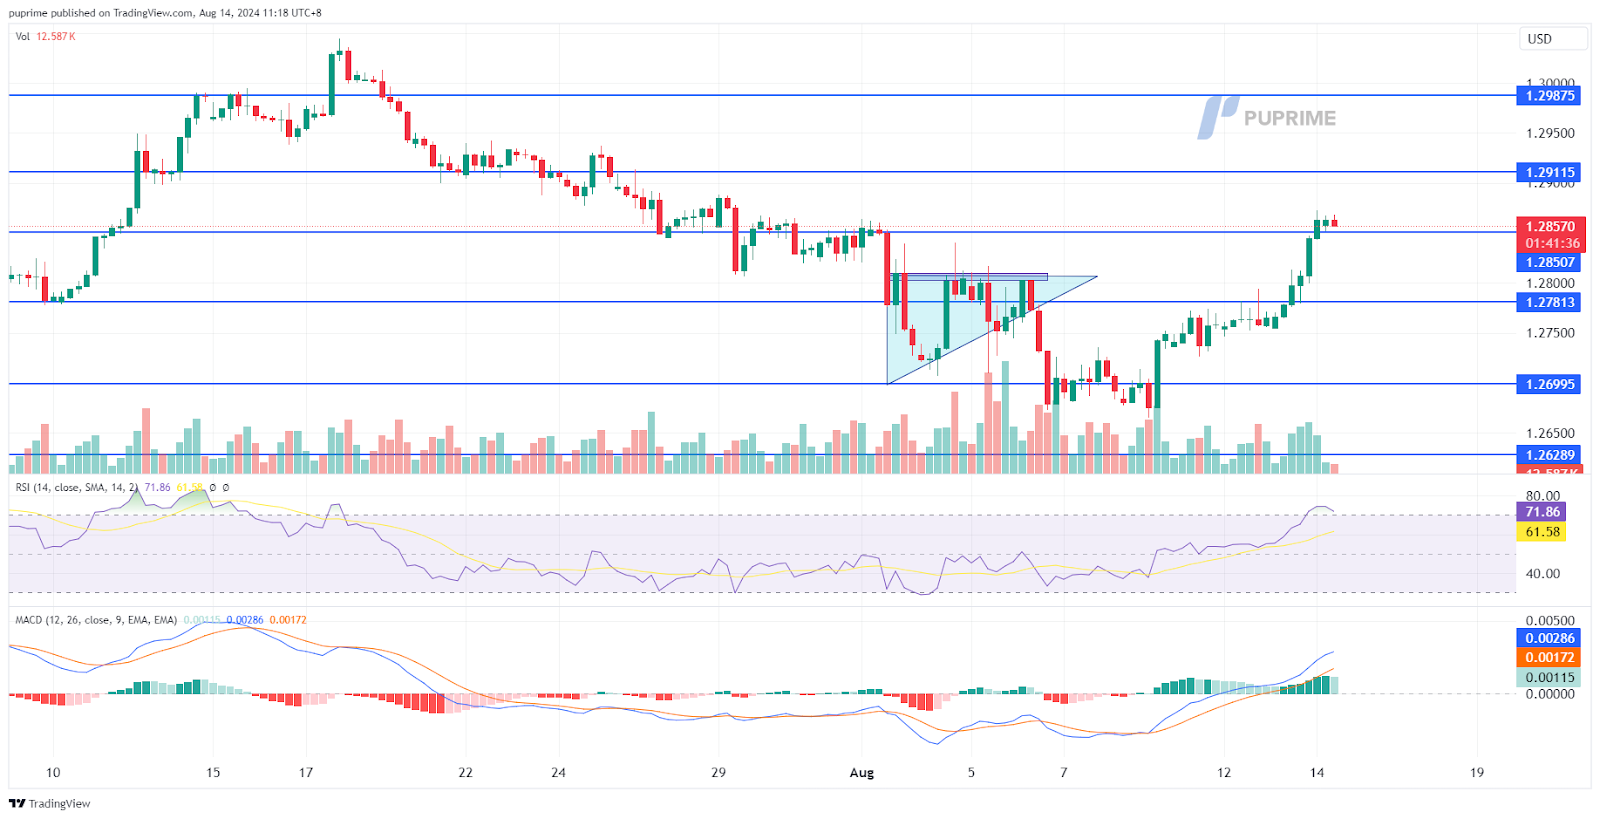
GBP/USD,H4
The British pound broke out of its recent consolidation range, advancing nearly 1% in the last session. Multiple factors fueled the rally, including a lower-than-expected U.K. unemployment rate, which highlighted the ongoing tightness in the U.K. labour market. This data provided the momentum needed for the pound to break out of its sideways trading pattern. Additionally, the softer U.S. PPI reading further supported the pound’s ascent in the later session, as it weighed on the U.S. dollar, allowing the GBP/USD pair to push higher.
GBP/USD has broken its downtrend structure, and a break above its sideway range suggests the pair had a trend reversal and a bullish bias for the pair. The RSI has broken into the overbought zone, while the MACD has broken above the zero line and is diverging, suggesting the bullish momentum is strong.
Resistance level: 1.2915, 1.2988
Support level: 1.2780, 1.2700
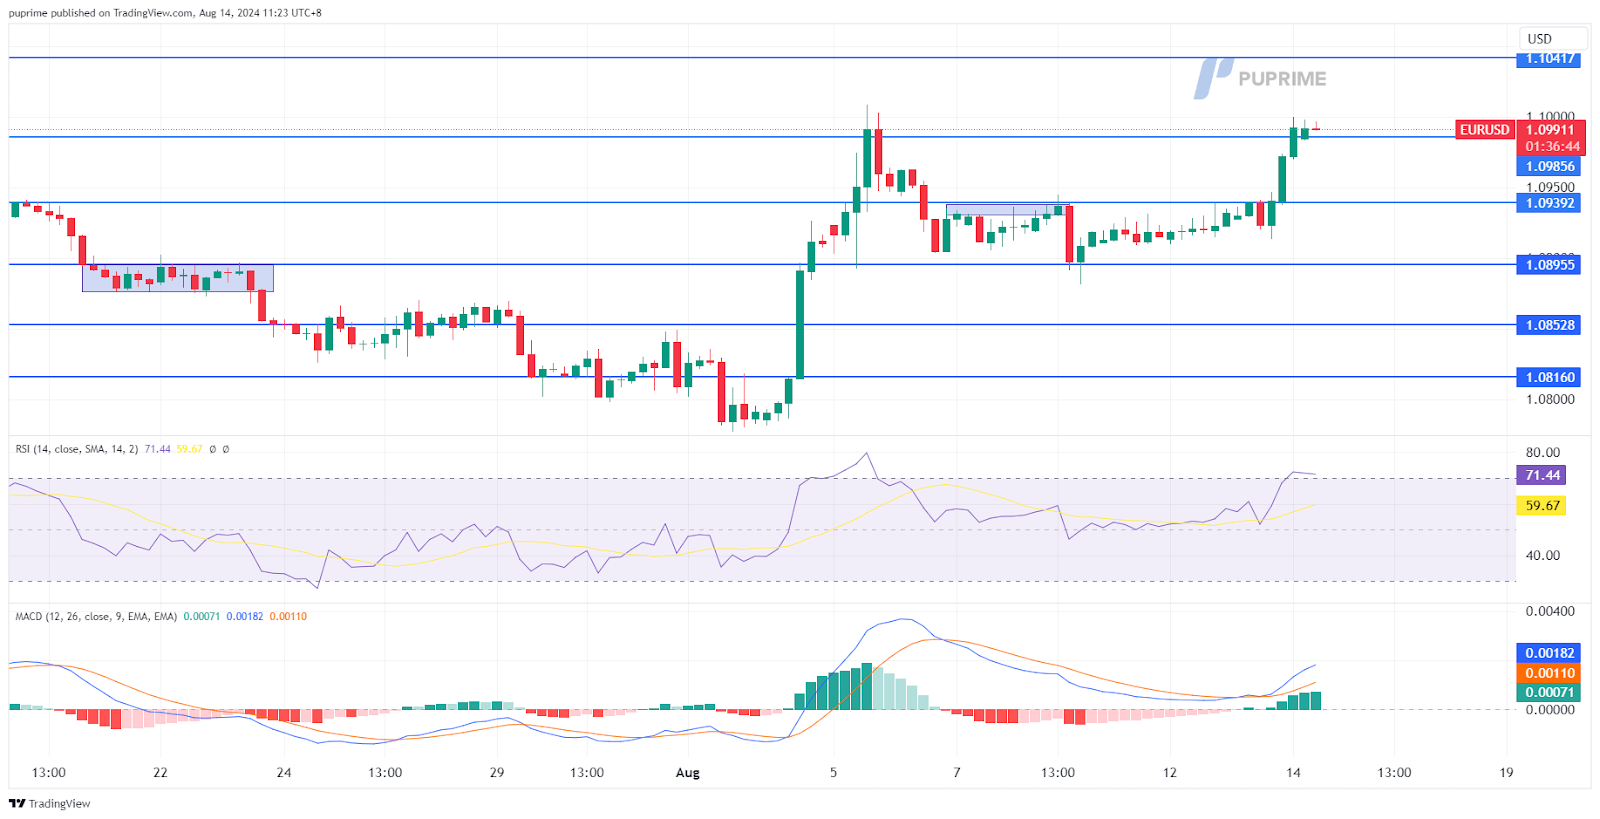
EUR/USD,H1
The EUR/USD pair is hovering near its recent highs, approaching the key psychological resistance level of 1.1000. The pair has been buoyed by the weakening U.S. dollar, driven by a softer-than-expected PPI reading released last night. Euro traders are now focused on the upcoming Eurozone GDP data, set to be released later today, which will offer insights into the region’s economic performance and provide further direction for the euro’s strength.
The EUR/USD is now resisting the key resistance level at the 1.1000 mark; a break above this level will be a bullish signal for the pair. The RSI has gotten into the overbought zone, while the MACD has rebounded from above the zero line, suggesting that bullish momentum is forming.
Resistance level: 1.1040, 1.1105
Support level: 1.0940, 1.0895
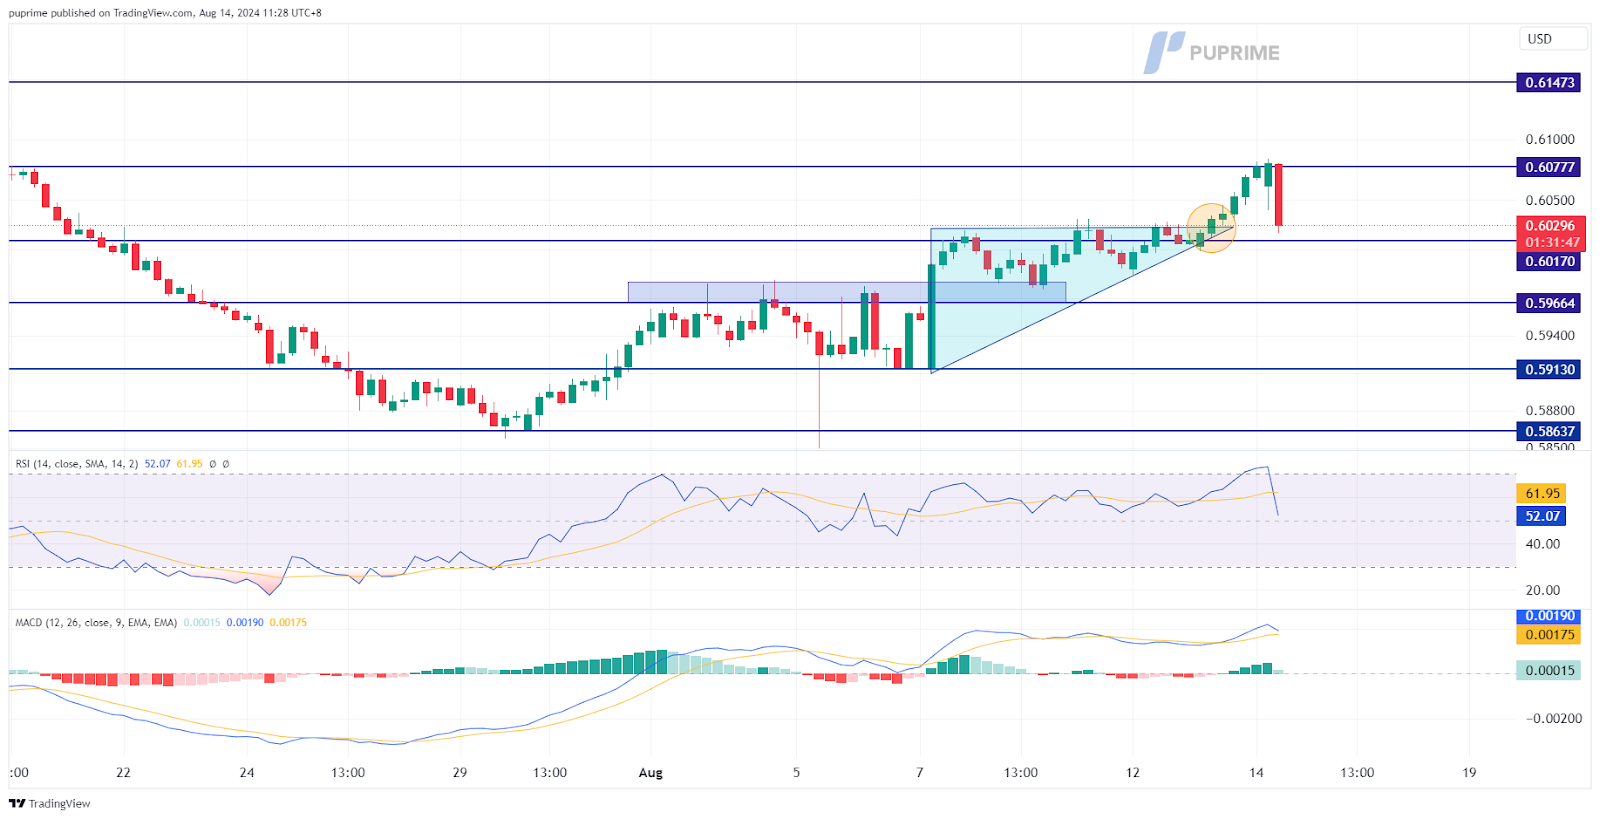
NZD/USD, H4
The NZD/USD pair initially traded in an uptrend after breaking above an ascending triangle pattern. However, the Kiwi lost momentum as the Reserve Bank of New Zealand (RBNZ) unexpectedly cut its interest rate by 25 basis points to 5.25% during today’s Sydney session. This surprise monetary easing move by the RBNZ halted the pair’s upward trajectory. Traders are now turning their attention to the upcoming U.S. CPI reading, which will be crucial in determining the pair’s next direction.
The pair was rejected at its resistance level at 0.6080 but is currently supported at above 0.6015, suggesting it remains trading within its uptrend trajectory. The RSI has eased from the overbought zone, while the MACD remains elevated, suggesting the bullish momentum remains intact with the pair.
Livello di resistenza: 0,6150, 0,6210
Livello di supporto: 0,5965, 0,5910
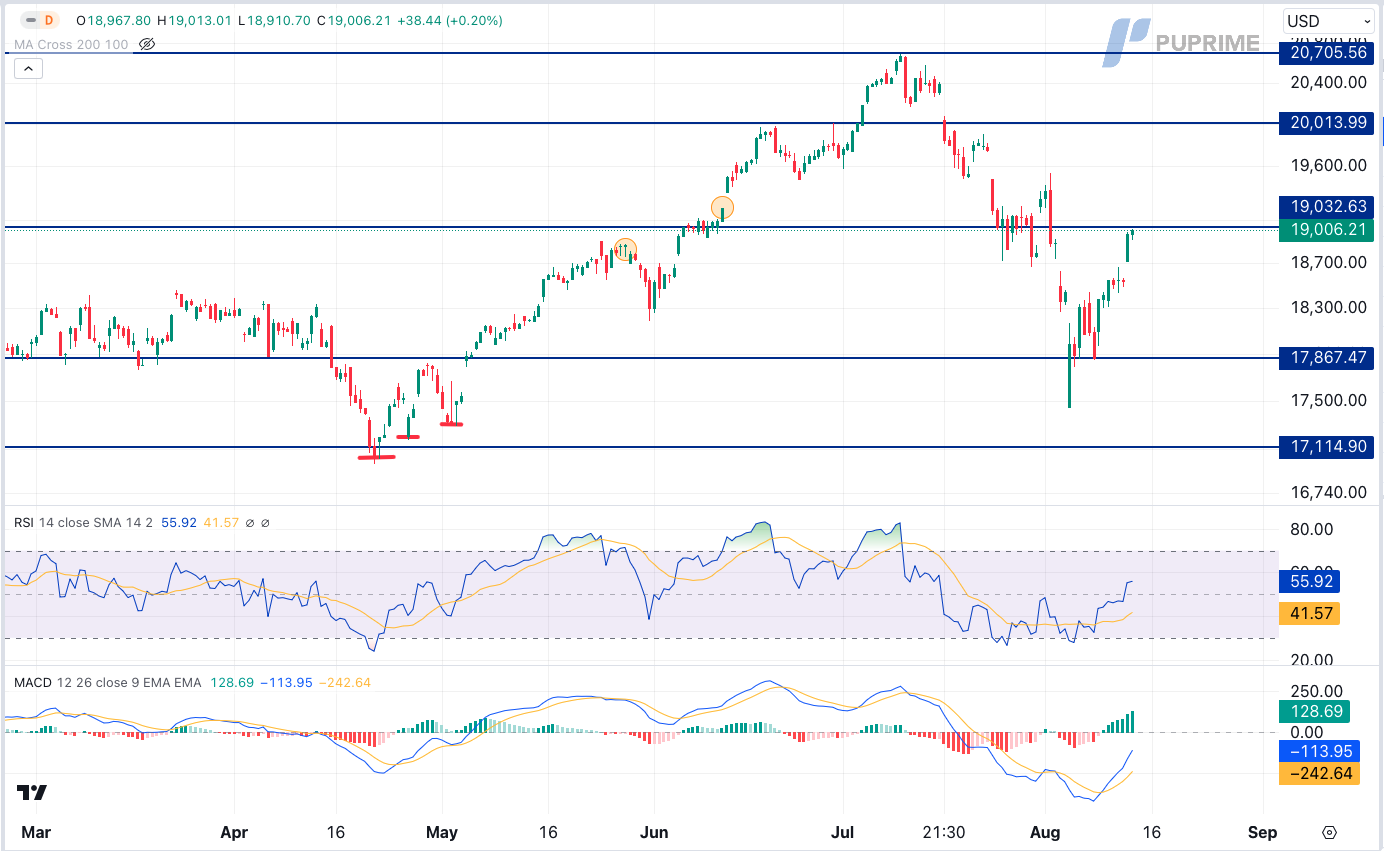
NASDAQ, H4
US Treasury yields rose as market participants now see a greater chance—more than 55%—that the Fed might cut rates by 50 basis points. Following the inflation report, US equity markets saw significant gains: the Dow Jones Industrial Average rose by 389 points (1%), the S&P 500 gained 1.5%, and the NASDAQ Composite climbed 2.3%.
Nasdaq is trading higher while currently testing the resistance level. MACD has illustrated increasing bullish momentum, while RSI is at 56, suggesting the index might extend its gains after breakout since the RSI stays above the midline.
Resistance level: 19035.00, 20015.00
Livello di supporto: 17865.00, 17115.00
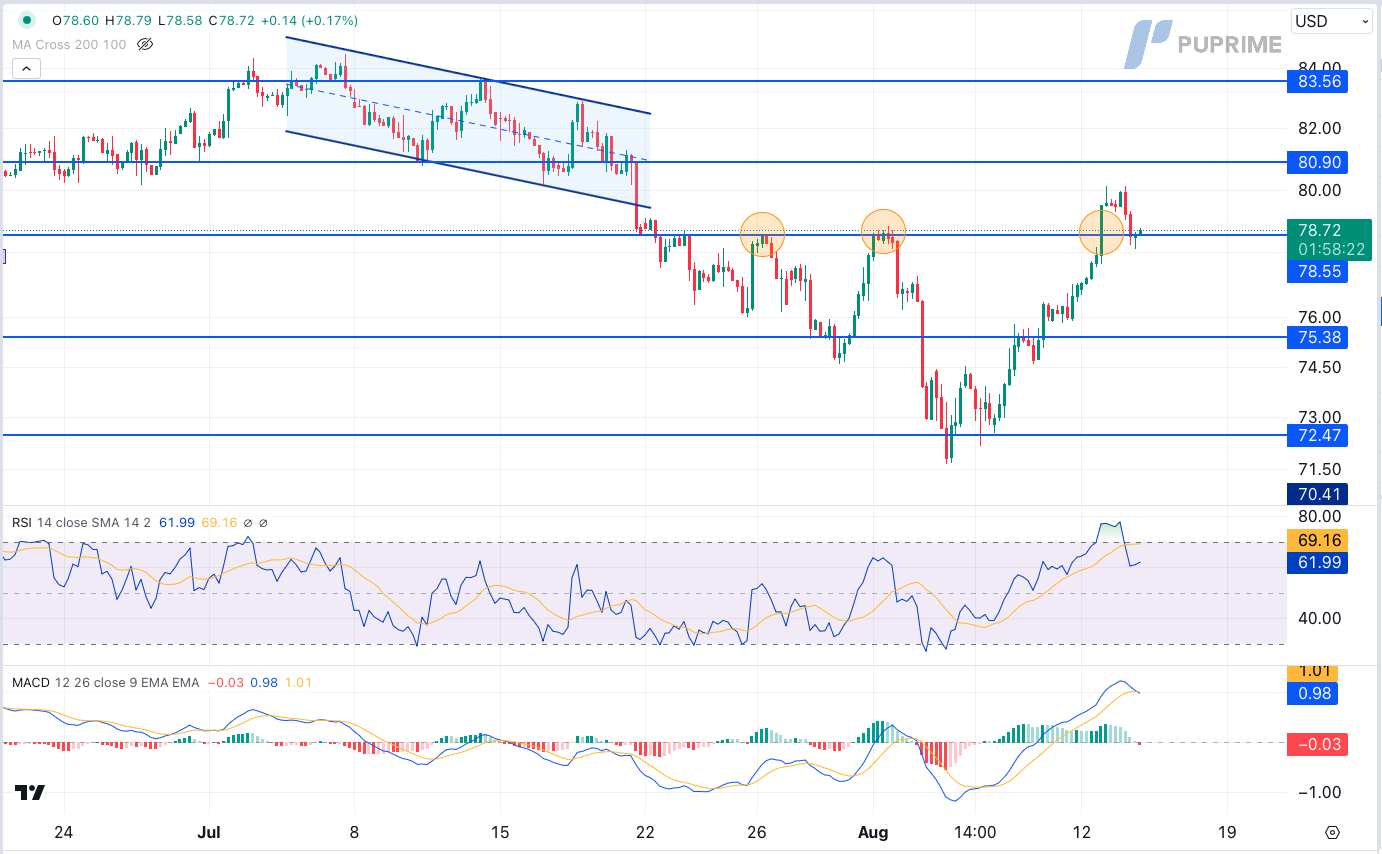
OLIO CL, H4
Crude oil prices retreated as concerns about a potential Middle East conflict eased. Iran has not yet acted on its threats of retaliation against Israel for the assassination of a Hamas official in Tehran. Despite the current decrease in tension, risks remain, and market participants should stay vigilant. On the demand front, the International Energy Agency (IEA) has kept its 2024 global oil demand growth forecast unchanged but reduced its 2025 estimate due to weak Chinese oil consumption and a pessimistic outlook for oil prices.
Oil prices are trading lower while currently testing the support level. MACD has illustrated diminishing bullish momentum, while RSI is at 62, suggesting the commodity might extend its losses after breakout since the RSI retreated sharply from overbought territory.
Livello di resistenza: 80,90, 83,55
Livello di supporto: 78,55, 75,40
Inizia a Fare Trading con un Vantaggio
Scambia forex, indici, metalli e altro ancora a spread bassi e con un'esecuzione fulminea.
Inizia a fare trading con depositi a partire da $50 sui nostri conti standard.
Ottieni accesso all'assistenza 24/7
Accedi a centinaia di strumenti, a strumenti didattici gratuiti e ad alcune delle migliori promozioni in circolazione.
Il Sito è destinato a persone residenti in giurisdizioni in cui l'accesso al Sito è consentito dalla legge.
Si prega di notare che PU Prime e le sue entità affiliate non hanno sede né operano nella giurisdizione del vostro paese.
Facendo clic sul pulsante "Riconosci", l'utente conferma di essere entrato in questo sito web esclusivamente su sua iniziativa e non come risultato di una specifica attività di marketing. Desiderate ottenere informazioni da questo sito web che sono fornite su sollecitazione inversa in conformità con le leggi della vostra giurisdizione.
Tenete presente che il sito web è destinato a persone che risiedono in giurisdizioni in cui l'accesso al sito web è consentito dalla legge.
Tieni presente che PU Prime e le sue entità affiliate non sono stabilite né operano nella tua giurisdizione di origine.
Facendo clic sul pulsante "Accetta", si conferma che si sta accedendo a questo sito web per iniziativa propria e non come risultato di alcuno sforzo di marketing specifico. Desideri ottenere informazioni da questo sito web che ti vengono fornite tramite una richiesta inversa in conformità con le leggi della tua giurisdizione di origine.