The ADP Nonfarm Employment Change data released yesterday provided a preview of the highly anticipated Nonfarm Payroll report due on Friday. The dollar tumbled to its lowest level in two months following the disappointing job data, which reinforced bets on a Federal Reserve rate cut. This speculation of a dovish shift in Fed policy spurred U.S. equity markets, with both the Nasdaq and S&P 500 reaching new highs. The softened dollar also buoyed commodities, with both gold and oil edging higher in the last session.
Meanwhile, the Bank of Canada, as expected, cut its interest rate by 25 basis points, becoming the first major central bank to start easing its monetary policy amid easing inflation in the country. Attention now turns to the European Central Bank (ECB), with its interest rate decision due later today. The market is anticipating that the ECB might follow the Bank of Canada and begin cutting rates.
Le attuali scommesse sul rialzo dei tassi 12 giugno Decisione sui tassi di interesse della Fed:
Fonte: Strumento Fedwatch del CME
0 bps (98.9%) VS -25 bps (1.1%)
Panoramica del mercato
Calendario economico
(Tempo del sistema MT4)
Fonte: MQL5
Movimenti di mercato
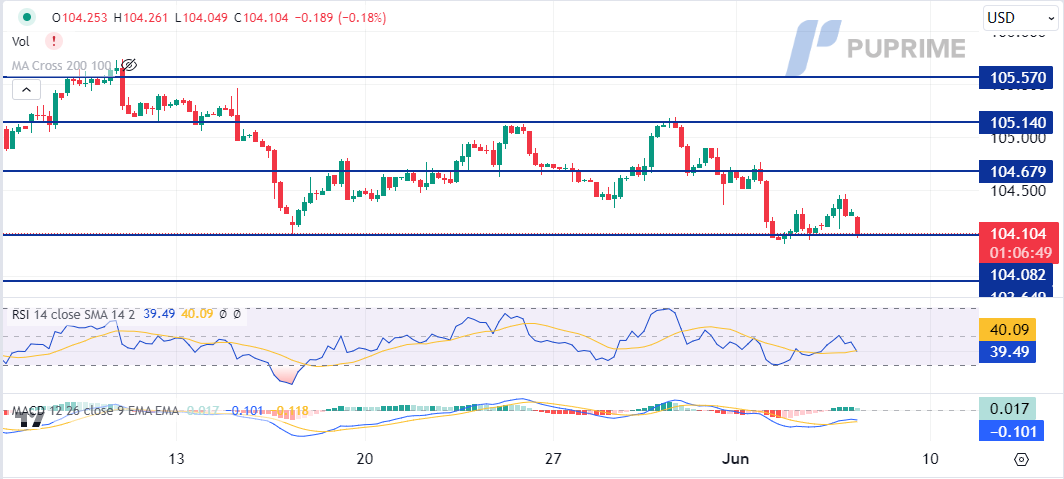
DOLLARO_INDICE, H4
The US Dollar remained flat, hovering around a key support level, as global investors await the much-anticipated US jobs report. The dollar’s prospects appear bearish, weighed down by a series of disappointing US economic indicators. According to Automatic Data Processing (ADP), the US ADP Nonfarm Employment Change dropped from 188,000 to 152,000, missing the expected 173,000. Additionally, the ISM Non-Manufacturing Prices Index fell to 58.1, below the market forecast of 59.0. Despite these setbacks, the losses were tempered by positive ISM Non-Manufacturing PMI data. The dollar’s trend remains data-dependent with no significant market catalysts.
The Dollar Index is trading lower while currently testing the support level. MACD has illustrated diminishing bullish momentum, while RSI is at 39, suggesting the index might extend its losses after breakout the support level.
Resistance level: 104.70, 105.15
Support level: 104.10, 103.65
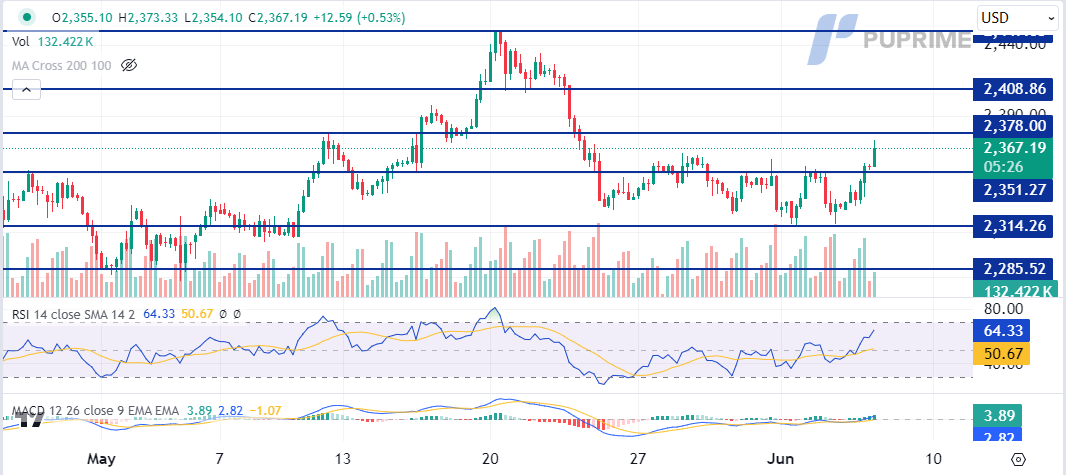
XAU/USD, H4
Gold prices rebounded, buoyed by a string of disappointing US economic data that has darkened the economic outlook and driven investors towards safe-haven assets. The persistent trend of worse-than-expected US economic results has fueled pessimism, further supporting gold’s appeal. For clearer trend directions, investors are advised to monitor upcoming US Nonfarm Payrolls and Unemployment rate reports. These key indicators will provide further trading signals and insights into the economic landscape.
Gold prices are trading higher following the prior breakout above the previous resistance level. MACD has illustrated increasing bullish momentum, while RSI is at 64, suggesting the commodity might extend its gains toward resistance level since the RSI stays above the midline.
Resistance level: 2380.00, 2410.00
Support level: 2350.00, 2315.00
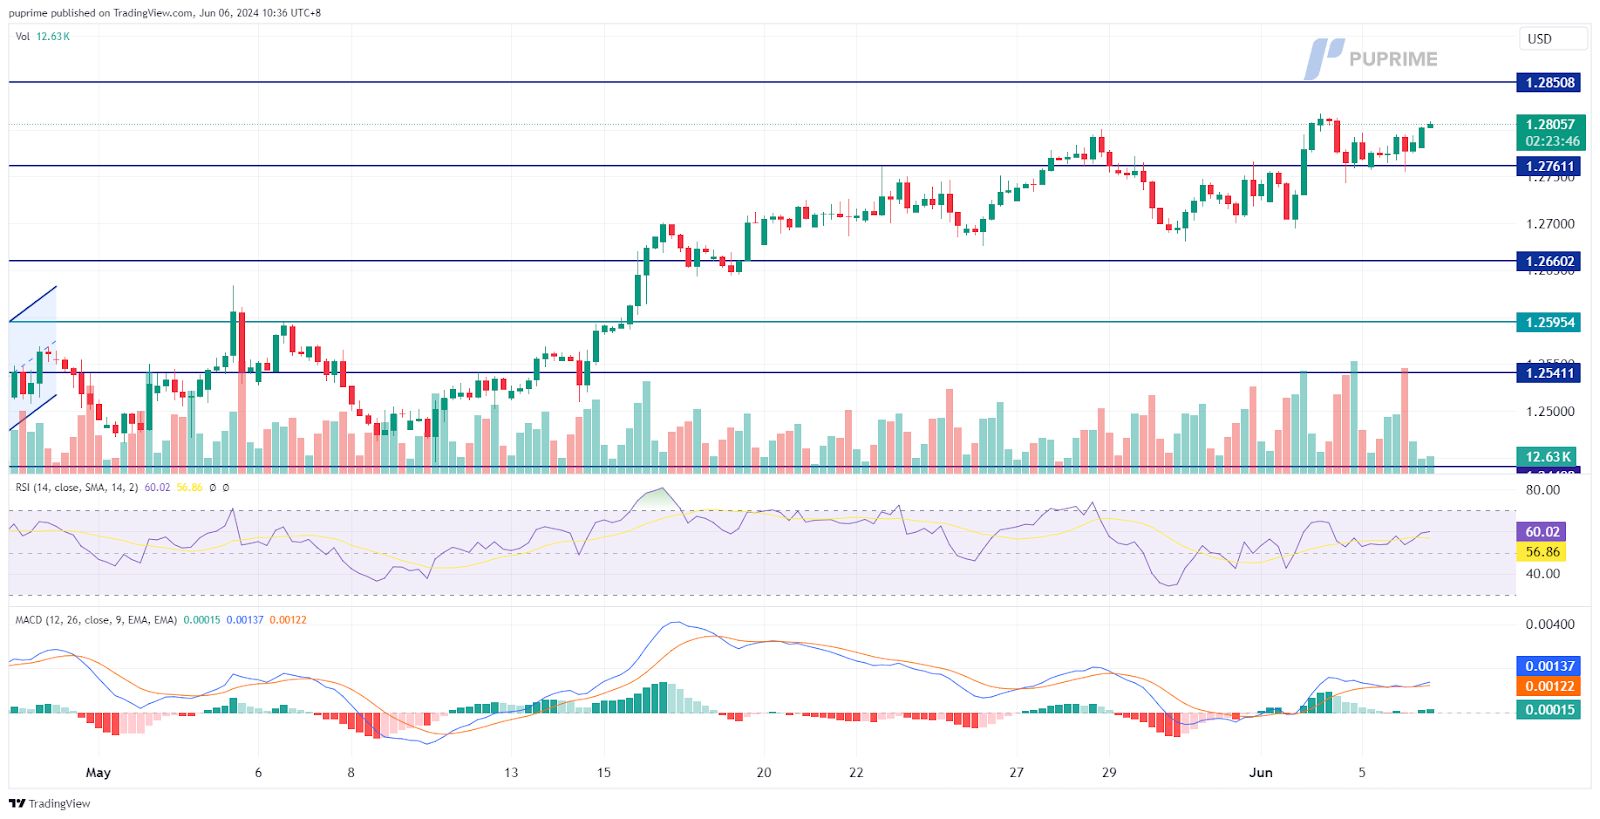
GBP/USD,H4
The GBP/USD pair is on the verge of breaking its recent high and climbing towards the next resistance level at 1.2850. This movement is primarily driven by the weakening dollar, which has been pressured by the poor ADP Nonfarm Employment Change data, fostering dovish expectations for the Federal Reserve. Additionally, the Sterling is bolstered by the UK’s PMI reading, which exceeded market expectations, indicating stronger-than-anticipated economic growth in the country.
GBP/USD has been trading upward since last month and is testing its recent high level, suggesting a bullish signal for the pair. The RSI is gaining and reaching the overbought zone, while the MACD has signs of continuing to surge, suggesting the bullish momentum remains intact with the pair.
Livello di resistenza: 1,2850, 1,2940
Support level: 1.2760, 1.2660
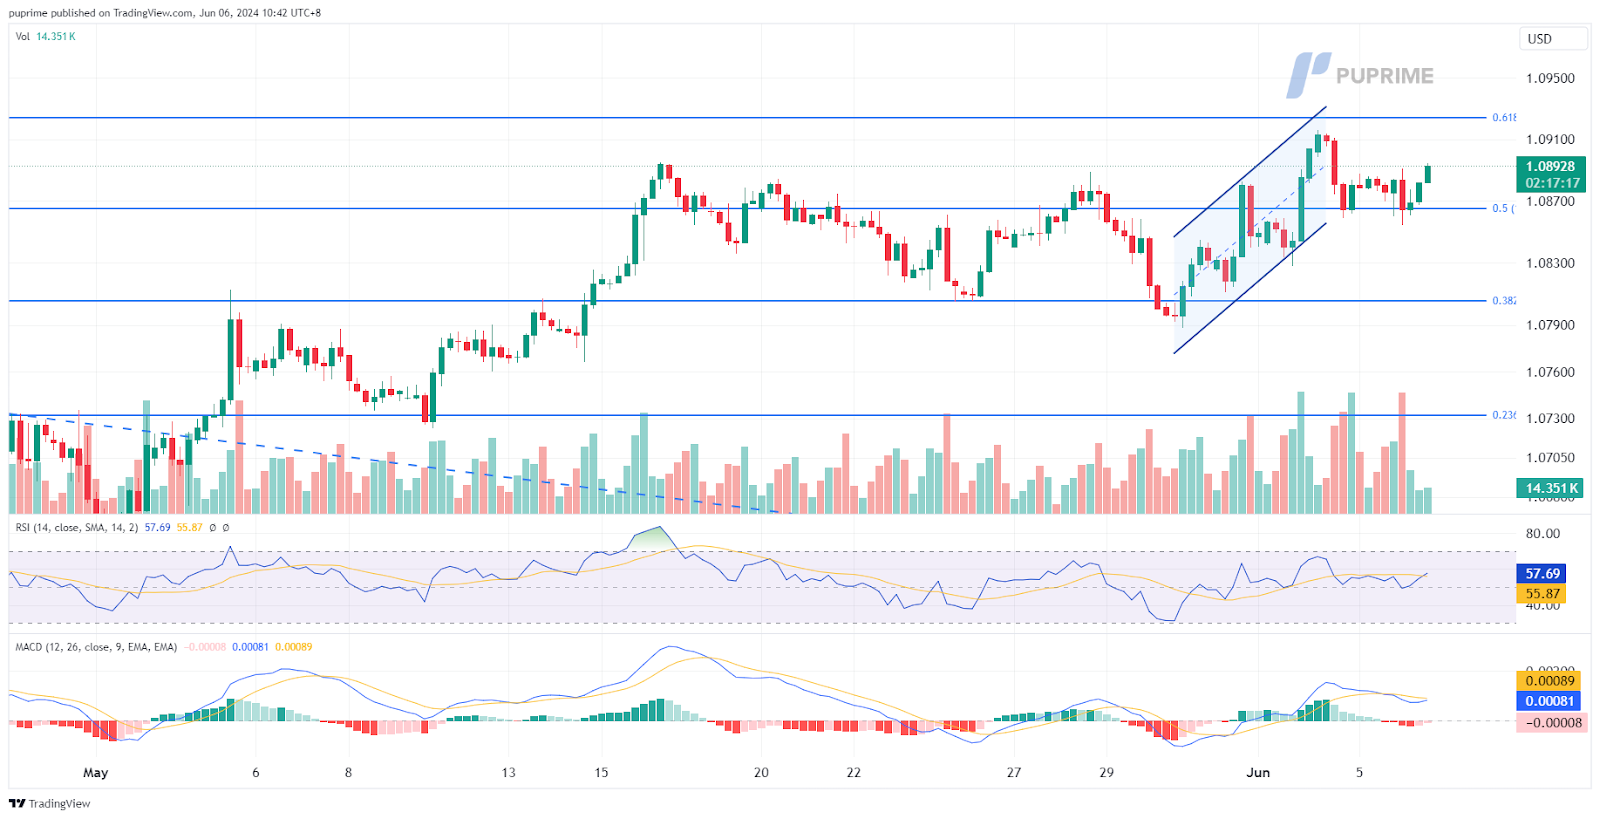
EUR/USD,H4
The EUR/USD pair is hovering near its recent high as the dollar weakens following disappointing U.S. job data that failed to meet market expectations. However, euro traders should be cautious ahead of the European Central Bank’s (ECB) interest rate decision due later today. The market anticipates the ECB may start cutting interest rates, a move that could directly impact the euro’s strength and potentially hinder its upward momentum.
The EUR/USD remains on an upward trajectory and is testing its near resistance level at 1.0920. The RSI remains hovering in the upper region while the MACD has signs of rebounding above the zero line, suggesting the bullish momentum remains intact with the pair.
Resistance level: 1.0925, 1.1000
Support level: 1.0865, 1.0800
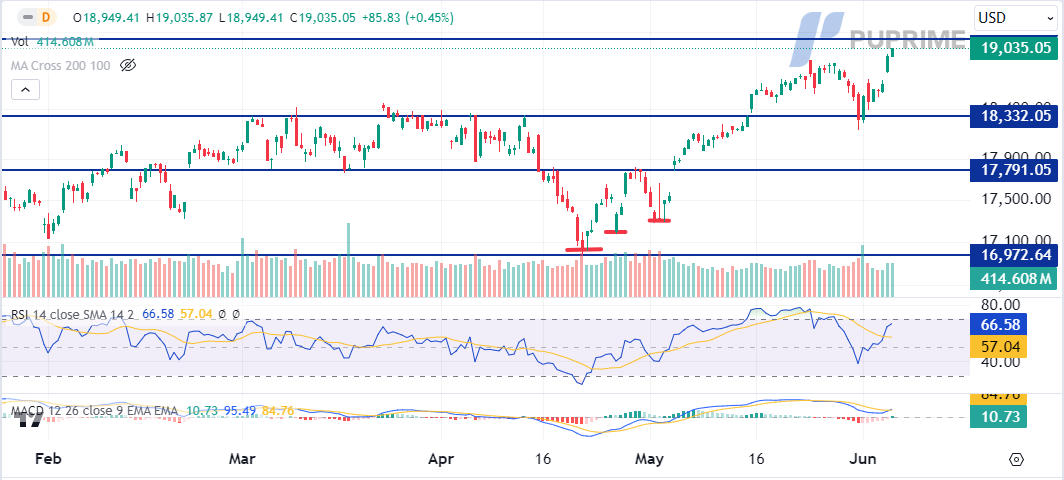
NASDAQ,H4
The Nasdaq closed at fresh record highs, bolstered by Nvidia-led strength in the tech sector and declining US Treasury yields. Signs of a cooling labor market have lifted hopes that the Federal Reserve might cut interest rates later this year. Treasury yields have continued to fall, with data showing fewer-than-expected private sector job creations in May, boosting rate-cut bets. About 65% of traders now expect the Fed to implement a 25 basis-point reduction in September, up from below 50% a year ago, according to CME’s FedWatch Tool. Nvidia (NASDAQ) surged 5% on Wednesday, pushing its market value above $3 trillion for the first time.
Nasdaq is trading higher while currently testing resistance level. MACD has illustrated diminishing bearish momentum, while RSI is at 67, suggesting the index might extend its gains since the RSI stays above the midline.
Resistance level: 19125.00, 19690.00
Support level: 18430.00, 17850.0
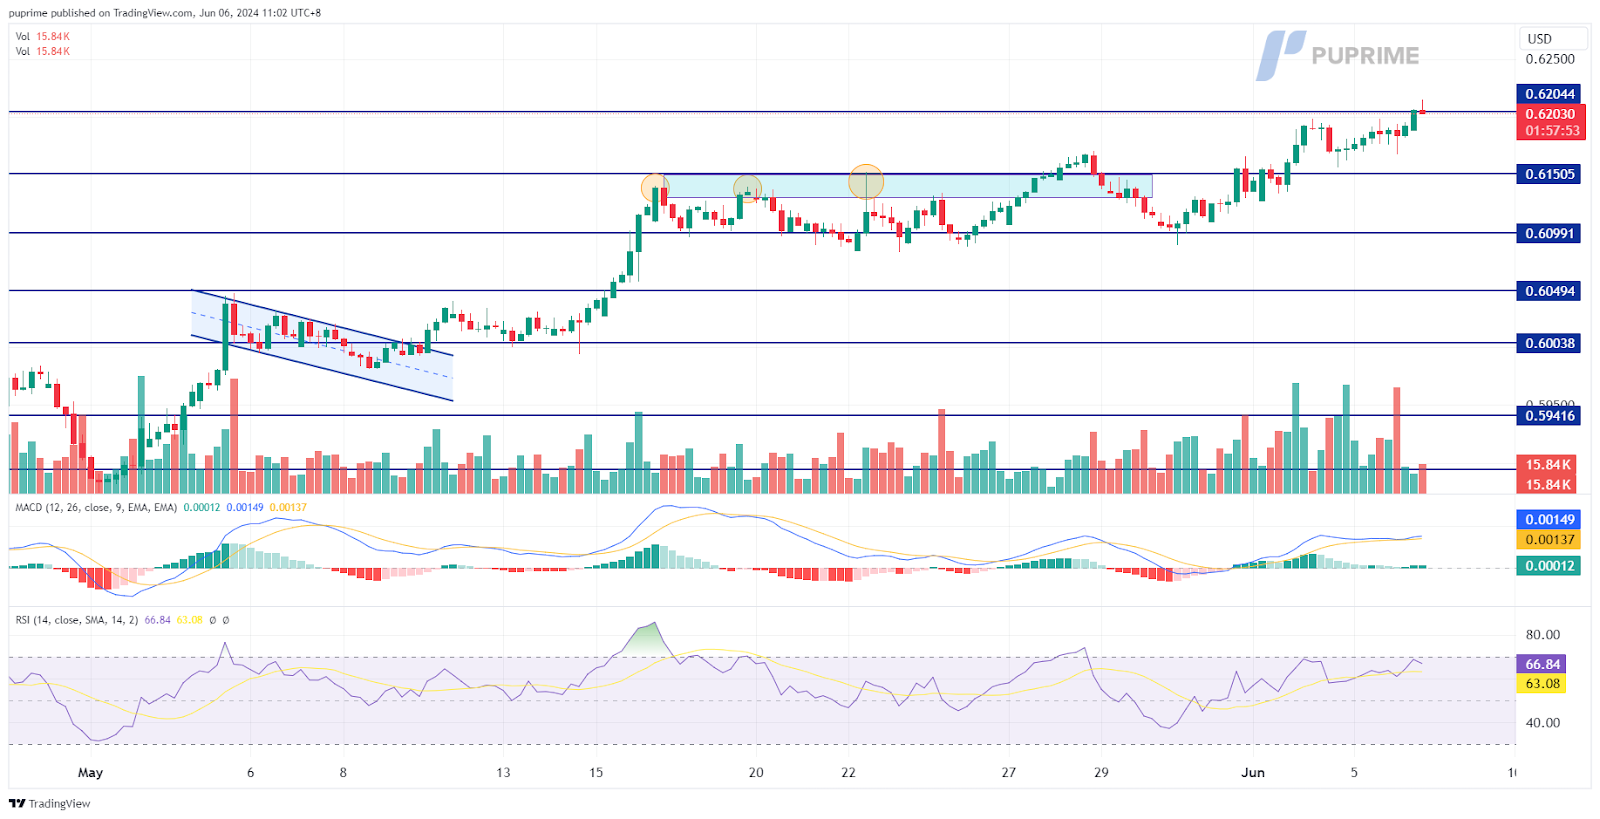
NZD/USD, H4
The NZD/USD pair is attempting to break its 3-month high level at 0.6205, with a successful break above this level signalling a solid bullish trend for the pair. The New Zealand dollar is supported by recent upbeat economic data and a hawkish stance from the Reserve Bank of New Zealand (RBNZ). Additionally, the recent positive Chinese Caixin PMI reading has stimulated the New Zealand dollar, often seen as a proxy for the Chinese economy, further strengthening its position.
The NZD/USD continues to trade upward, and breaking above its near resistance level at 0.6205 will serve as a bullish signal for the pair. The MACD has a sign to edge higher, while the RSI is on the brink of breaking into the overbought zone, suggesting that the bullish momentum remains strong.
Resistance level: 0.6205, 0.6255
Support level: 0.6150, 0.6100
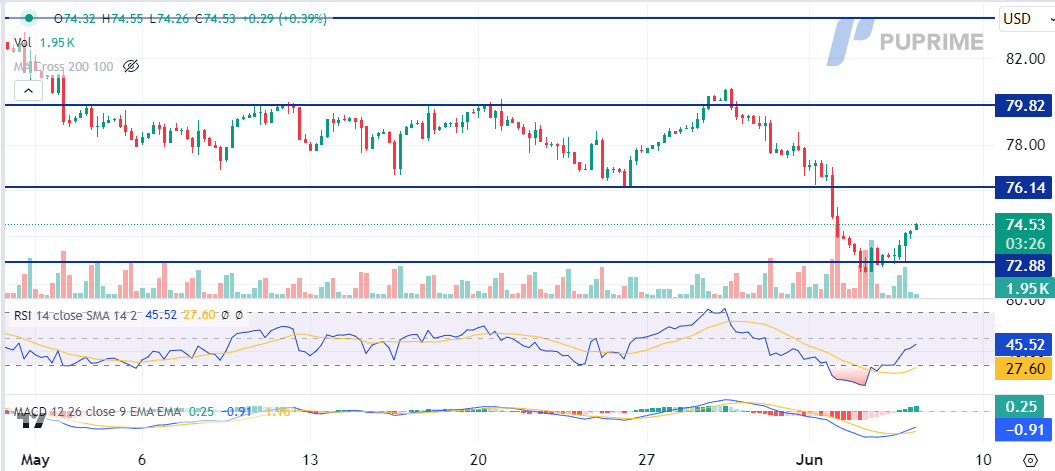
OLIO CL, H4
Oil prices rebounded from four-month lows, driven by expectations of a potential Fed rate cut following recent pessimistic US economic data. Additionally, ongoing expectations of aggressive oil output cuts from OPEC+ have supported prices. However, gains were capped by a downbeat inventory report. According to the Energy Information Administration (EIA), US crude oil inventories increased by 1.233 million barrels, significantly higher than the market expectation of a 2.100 million barrel decrease. The interplay of these factors continues to influence the oil market dynamics.
Oil prices are trading higher following the prior rebound from the support level. MACD has illustrated increasing bullish momentum, while RSI is at 46, suggesting the commodity might extend its gains toward resistance level since the RSI rebounded sharply from oversold territory.
Resistance level: 76.15, 79.80
Support level: 72.90, 70.15
Inizia a Fare Trading con un Vantaggio
Scambia forex, indici, metalli e altro ancora a spread bassi e con un'esecuzione fulminea.
Inizia a fare trading con depositi a partire da $50 sui nostri conti standard.
Ottieni accesso all'assistenza 24/7
Accedi a centinaia di strumenti, a strumenti didattici gratuiti e ad alcune delle migliori promozioni in circolazione.
Il Sito è destinato a persone residenti in giurisdizioni in cui l'accesso al Sito è consentito dalla legge.
Si prega di notare che PU Prime e le sue entità affiliate non hanno sede né operano nella giurisdizione del vostro paese.
Facendo clic sul pulsante "Riconosci", l'utente conferma di essere entrato in questo sito web esclusivamente su sua iniziativa e non come risultato di una specifica attività di marketing. Desiderate ottenere informazioni da questo sito web che sono fornite su sollecitazione inversa in conformità con le leggi della vostra giurisdizione.
Tenete presente che il sito web è destinato a persone che risiedono in giurisdizioni in cui l'accesso al sito web è consentito dalla legge.
Tieni presente che PU Prime e le sue entità affiliate non sono stabilite né operano nella tua giurisdizione di origine.
Facendo clic sul pulsante "Accetta", si conferma che si sta accedendo a questo sito web per iniziativa propria e non come risultato di alcuno sforzo di marketing specifico. Desideri ottenere informazioni da questo sito web che ti vengono fornite tramite una richiesta inversa in conformità con le leggi della tua giurisdizione di origine.