Il Dollar Index è sceso mentre gli investitori hanno preso profitto in vista dei dati economici e degli eventi chiave della settimana, tra cui l'indice di inflazione preferito dalla Fed, l'indice dei prezzi delle spese per consumi personali (PCE). Con i mercati statunitensi chiusi per festività, le contrattazioni dei prodotti legati al dollaro dovrebbero essere contenute. Gli investitori stanno anche osservando i discorsi di diversi funzionari della Fed per avere potenziali indicazioni sulle future decisioni in materia di tassi d'interesse.
Gold prices remained steady amid the US holiday, reflecting subdued trading activity. Last week’s significant selloff in gold was driven by hawkish Fed statements and rising US Treasury yields. This week, investors are advised to monitor key US economic data, particularly the PCE price index and Fed speeches, for indications of future trends in the gold market.
I prezzi del greggio hanno registrato un leggero rimbalzo venerdì, ma hanno registrato perdite settimanali a causa delle preoccupazioni sull'impatto dei solidi dati economici statunitensi e delle aspettative da falco della Fed sulla domanda di petrolio. Gli operatori attendono con ansia la riunione dell'OPEC+ del 2 giugno, dove le discussioni si concentreranno sull'estensione dei tagli volontari alla produzione.
Le attuali scommesse sul rialzo dei tassi 12 giugno Decisione sui tassi di interesse della Fed:
Fonte: Strumento Fedwatch del CME
0 bps (98,8%) VS -25 bps (1,2%)
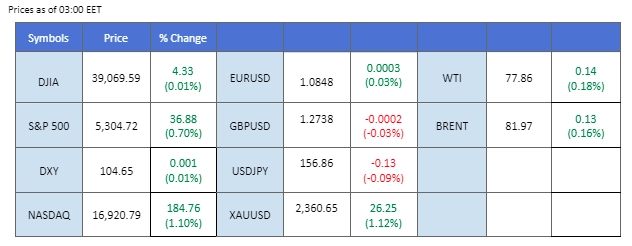
Panoramica del mercato
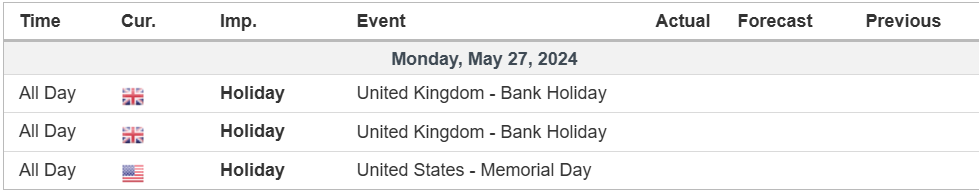
Calendario economico
(Tempo del sistema MT4)
Fonte: MQL5
Movimenti di mercato
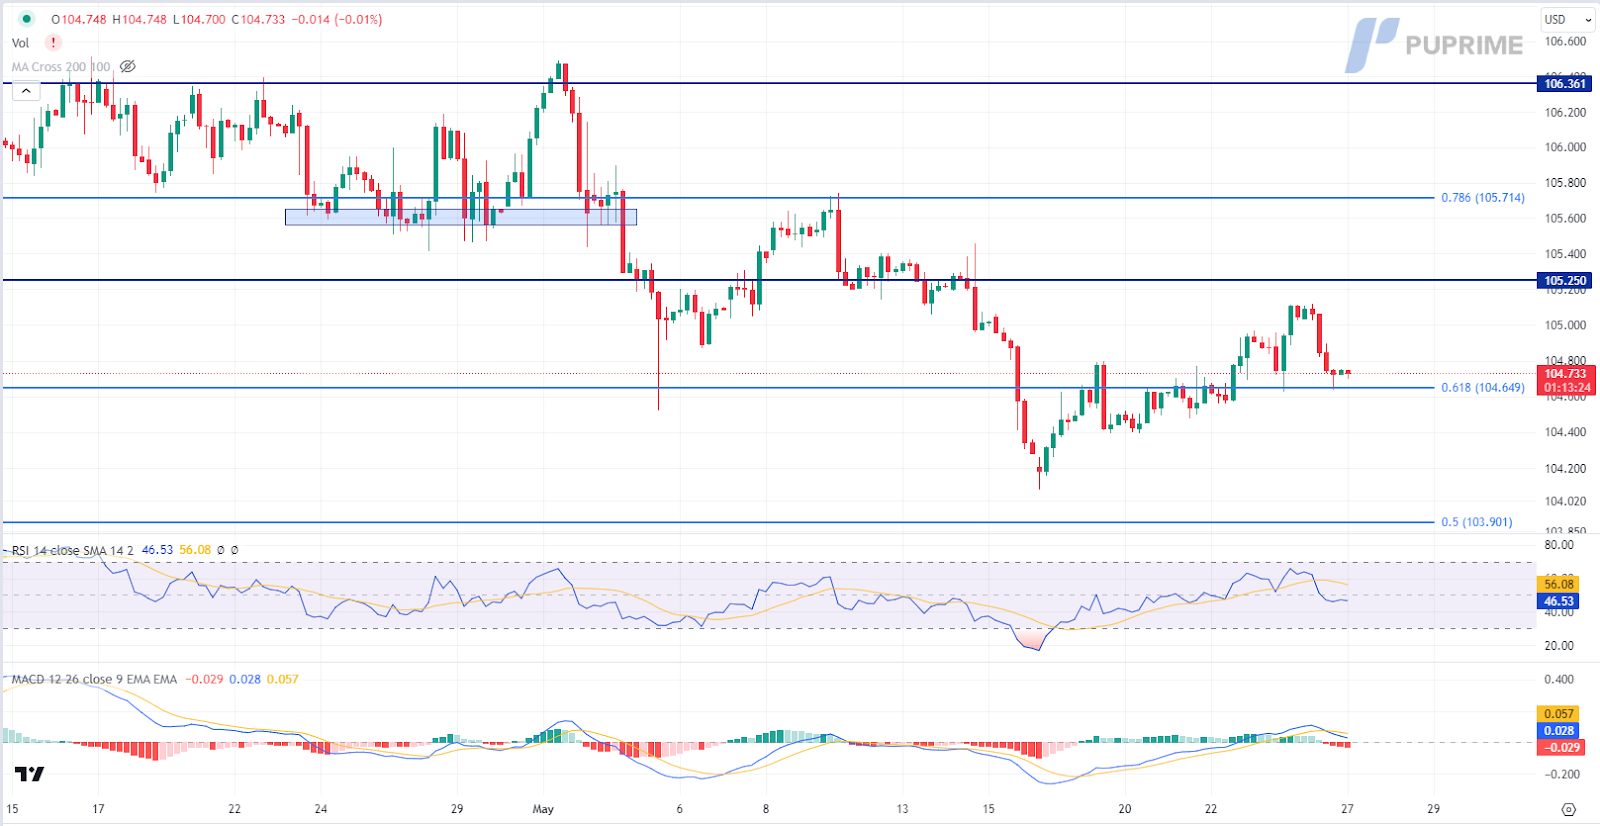
DOLLARO_INDICE, H4
L'indice del dollaro, che misura il biglietto verde rispetto a un paniere di sei valute principali, è sceso in quanto gli investitori hanno preso profitto in vista di diversi eventi ad alta volatilità nel corso della settimana. Con i mercati statunitensi chiusi per festività, si prevede che le contrattazioni dei prodotti legati al dollaro saranno contenute. Gli investitori guardano con attenzione all'indicatore dell'inflazione preferito dalla Fed, l'indice dei prezzi delle spese per consumi personali (PCE), previsto per venerdì, per avere indicazioni sulle future decisioni in materia di tassi d'interesse. Inoltre, questa settimana sono previsti interventi di diversi funzionari della Fed, che potrebbero fornire ulteriori informazioni sul mercato.
Il Dollar Index è in ribasso e attualmente si trova vicino al livello di supporto. Il MACD ha mostrato un crescente slancio ribassista, mentre l'RSI è a 47, suggerendo che l'indice potrebbe estendere le sue perdite dopo il breakout, dato che l'RSI rimane sotto la linea mediana.
Livello di resistenza: 105,25, 105,70
Livello di supporto: 104,65, 103,90
XAU/USD, H4
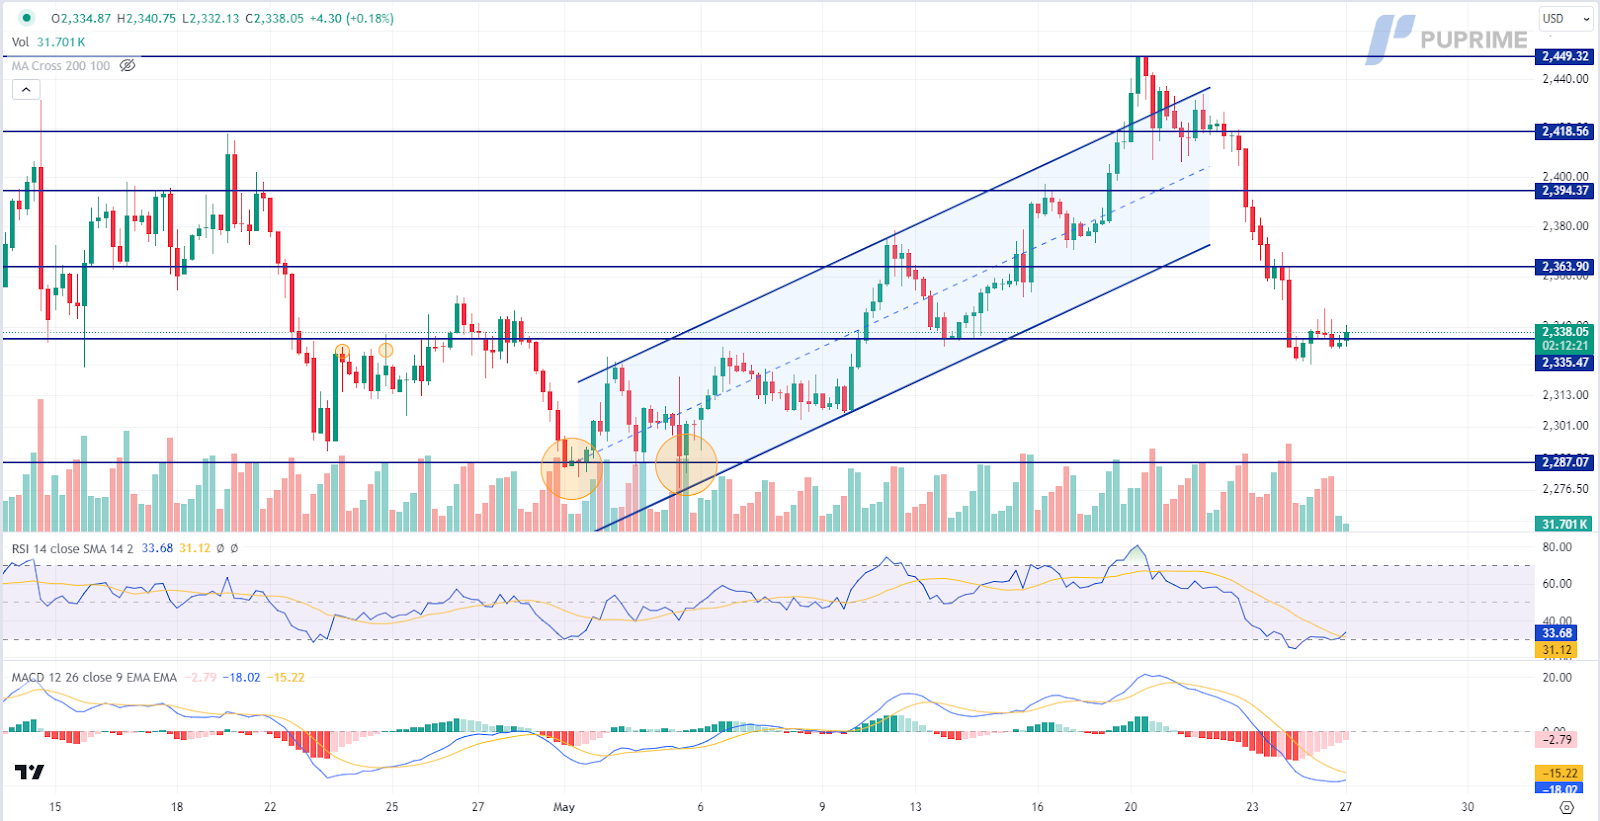
Le quotazioni dell'oro sono rimaste ferme, a causa della scarsa attività di trading dovuta alle festività statunitensi. La scorsa settimana, l'oro ha subito un significativo crollo a causa delle dichiarazioni da falco della Fed e dell'aumento dei rendimenti del Tesoro statunitense. Questa settimana si consiglia agli investitori di monitorare i principali dati ed eventi economici statunitensi, in particolare l'indice dei prezzi PCE e i discorsi della Fed, per avere indicazioni sulle future tendenze del mercato dell'oro.
I prezzi dell'oro sono in ribasso e stanno testando il livello di supporto. Tuttavia, il MACD ha mostrato una diminuzione del momentum ribassista, mentre l'RSI è a 33, suggerendo che la materia prima potrebbe entrare in territorio di ipervenduto.
Livello di resistenza: 2365.00, 2395.00
Livello di supporto: 2335.00, 2285.00
GBP/USD,H4
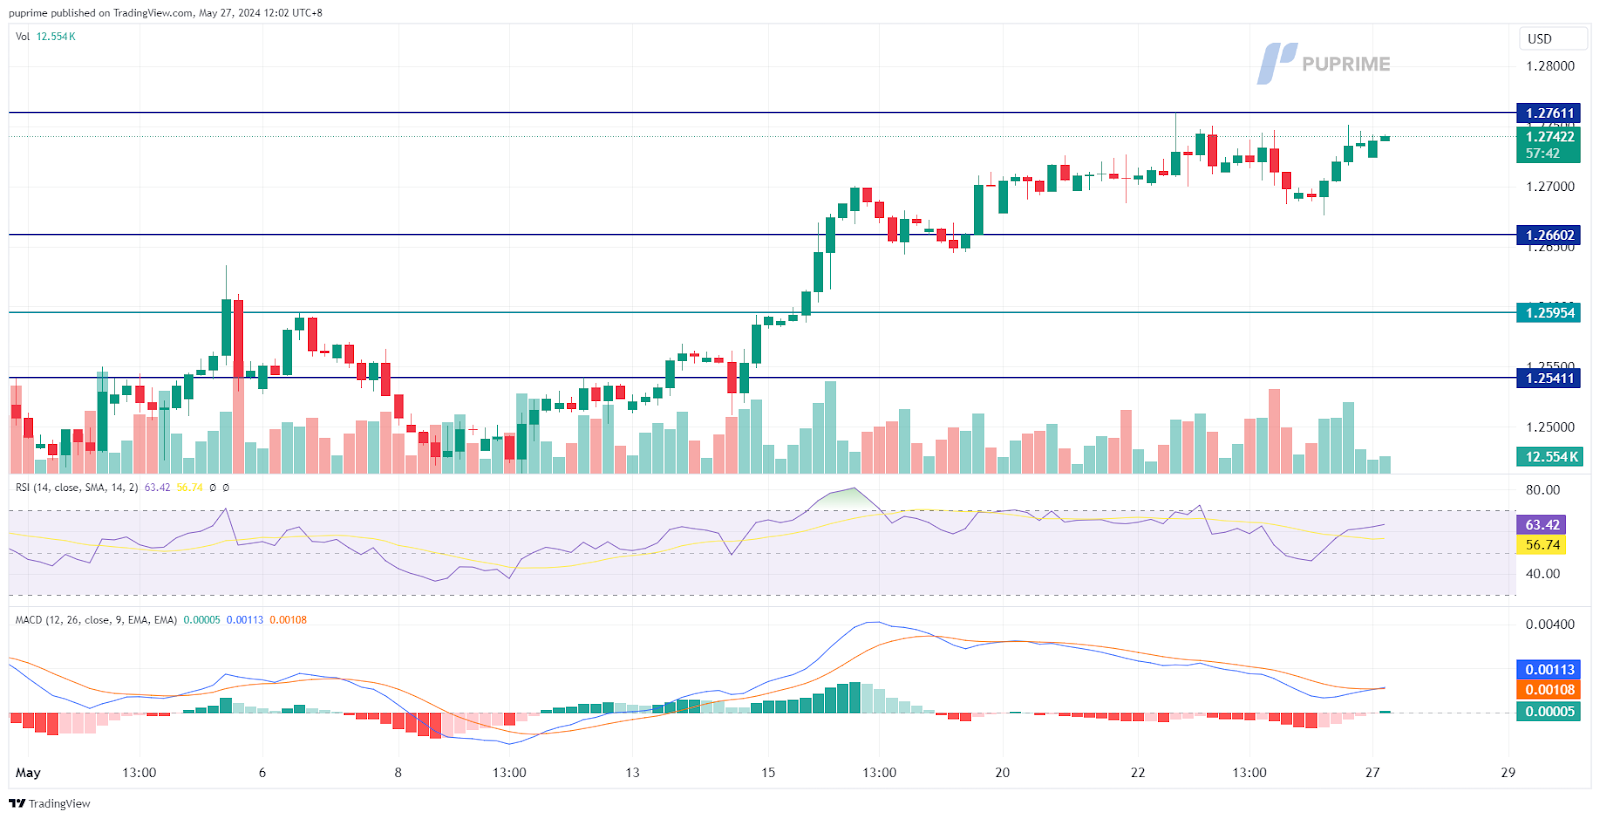
La sterlina rimane vicina ai massimi di due mesi rispetto al dollaro USA, anche se gli ultimi dati sulle vendite al dettaglio del Regno Unito sono stati inferiori alle aspettative del mercato. Le vendite al dettaglio del Regno Unito sono calate del 2,7%, indicando una contrazione dell'economia. Tuttavia, il ritracciamento del dollaro americano di venerdì scorso ha aiutato la coppia GBP/USD a mantenere i suoi livelli elevati. Ad aggravare la dinamica, il Tesoro statunitense è pronto ad attuare un programma di riacquisto di titoli di Stato. Si prevede che questa mossa ostacolerà i rendimenti del Tesoro, mettendo potenzialmente ulteriore pressione sul dollaro statunitense e fornendo ulteriore supporto alla coppia GBP/USD.
GBP/USD è scambiato al di sotto del suo forte livello di resistenza vicino a 1,2760, in attesa di un catalizzatore per rompere al di sopra. L'RSI rimane elevato, mentre il MACD mostra segni di rimbalzo al di sopra della linea dello zero, suggerendo che potrebbe formarsi un nuovo slancio rialzista.
Livello di resistenza: 1,2760, 1,2850
Livello di supporto: 1.2660, 1.2600
EUR/USD,H4
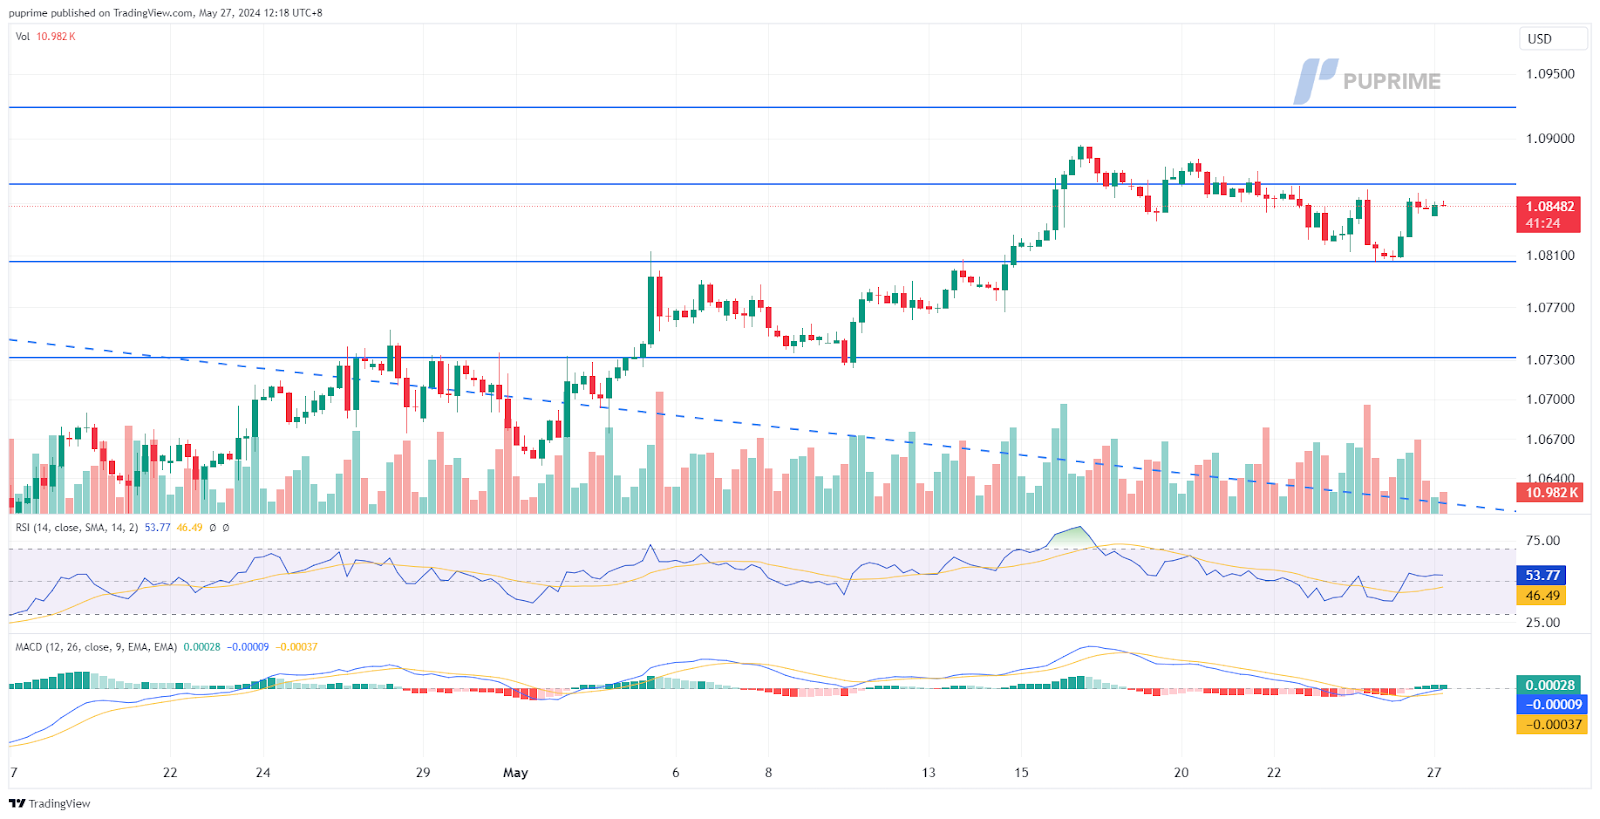
The EUR/USD pair defied expectations, staying above the key psychological support level of 1.0800. This suggests continued bullish momentum for the euro. However, recent economic data from the Eurozone has cast doubt on the European Central Bank’s (ECB) commitment to further monetary tightening. This could limit the euro’s upside potential. Market participants are now looking for signs of a potential policy pivot by the ECB away from its current hawkish stance.
La coppia EUR/USD ha formato un modello di massimo inferiore, suggerendo che il momentum rialzista si sta attenuando. L'RSI si sta gradualmente spostando verso il basso, mentre il MACD si è rotto sotto la linea dello zero, suggerendo che lo slancio rialzista sta svanendo.
Livello di resistenza: 1,0865, 1,0920
Livello di supporto: 1,0805, 1,0730
USD/JPY,H4
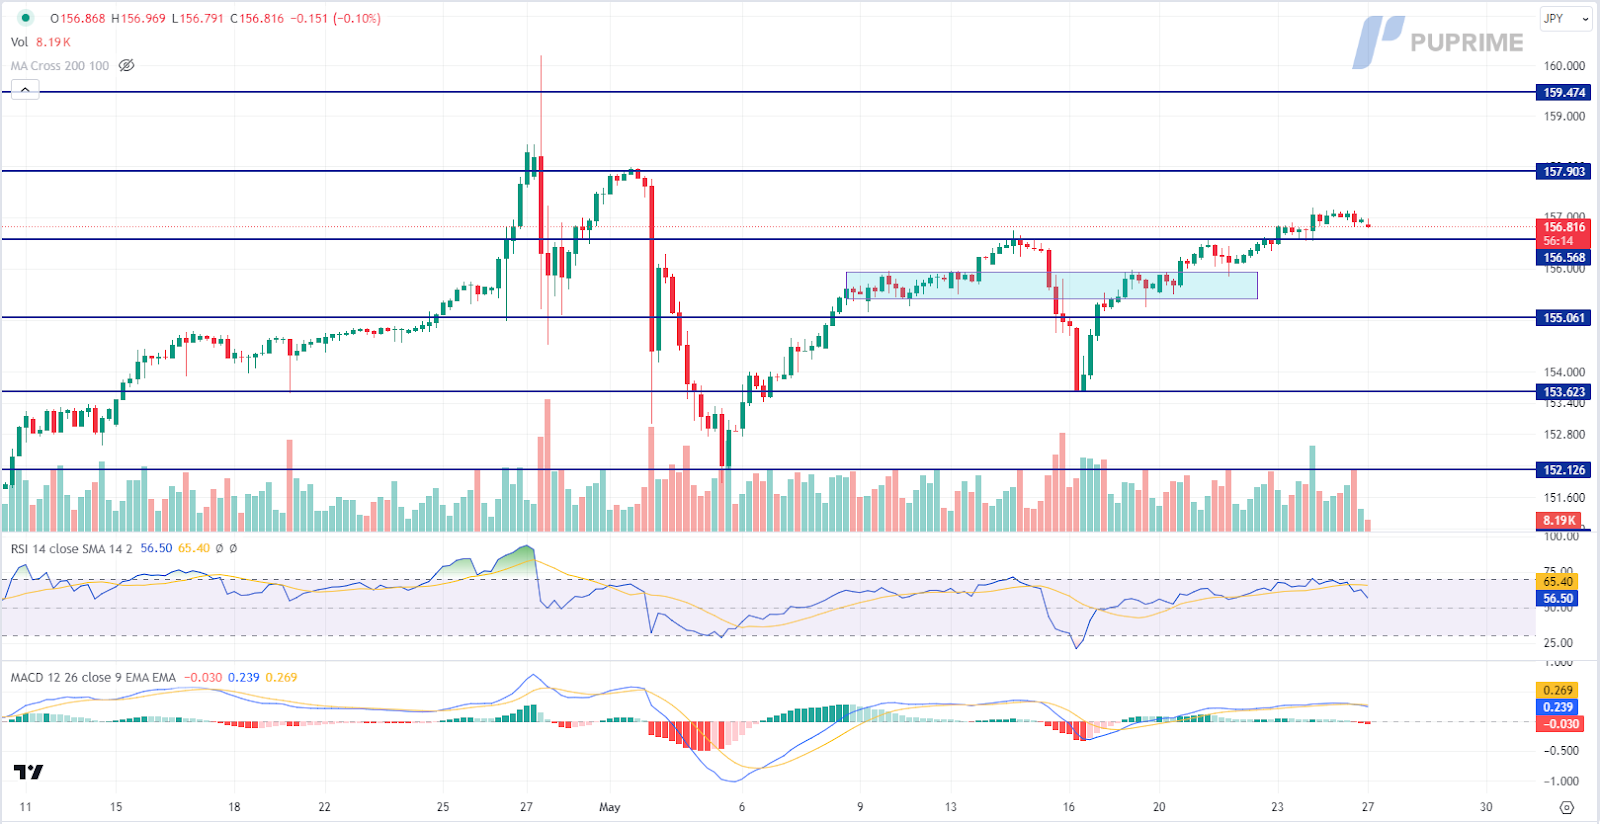
Lo yen giapponese rimane sotto pressione mentre gli investitori attendono i dati sull'inflazione di Tokyo previsti per venerdì. Gli operatori di mercato sono ansiosi di valutare quando la Banca del Giappone potrebbe prendere in considerazione un aumento dei tassi di interesse. Lo yen ha risentito dell'ampliamento dei differenziali dei tassi d'interesse e un'impennata a sorpresa dell'inflazione o un cambiamento nella politica della BoJ potrebbero innescare movimenti di mercato significativi. Gli investitori dovrebbero essere cauti e monitorare attentamente gli sviluppi di potenziali cambiamenti di politica monetaria.
La coppia USD/JPY è in rialzo dopo la precedente rottura del livello di resistenza. Tuttavia, il MACD ha mostrato un crescente slancio ribassista, mentre l'RSI è a 57, suggerendo che la coppia potrebbe estendere le sue perdite dal momento che l'RSI si è ritirato bruscamente dal territorio di ipercomprato.
Livello di resistenza: 157,90, 159,45
Livello di supporto: 156,55, 155,05
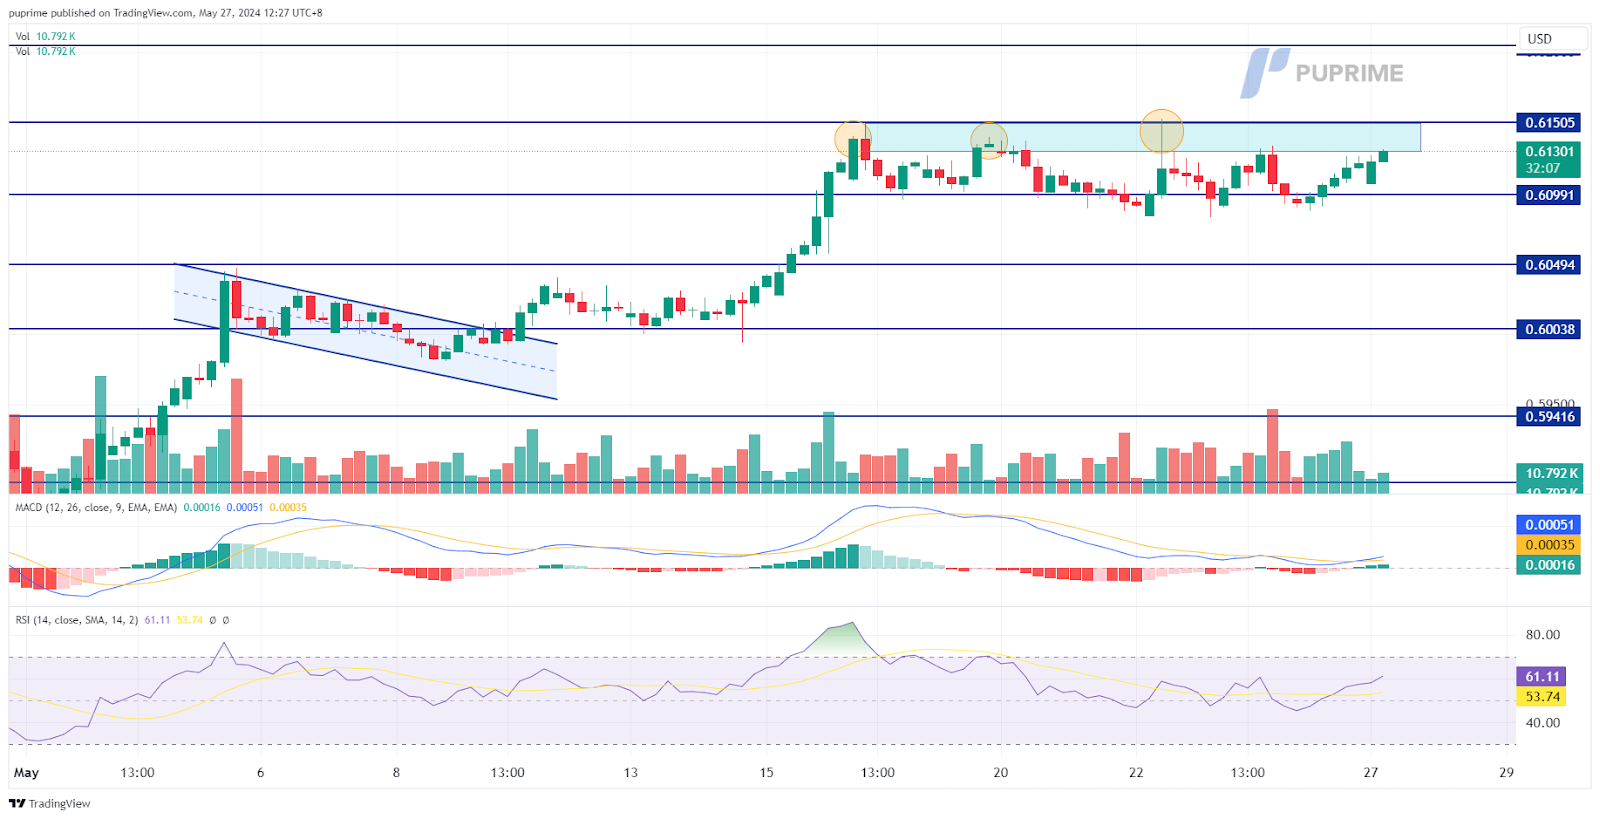
NZD/USD, H4
La coppia NZD/USD è rimasta bloccata in uno schema di consolidamento nell'ultima settimana, aggirandosi intorno al livello di resistenza di 0,6135. Questa azione laterale dei prezzi arriva nonostante l'elevata inflazione in corso in Nuova Zelanda, che di solito sostiene il dollaro Kiwi. Tuttavia, l'attenzione del mercato si è spostata verso la possibilità che la Federal Reserve effettui un taglio dei tassi nel corso dell'anno. Questa anticipazione sta pesando sulla coppia NZD/USD, poiché un potenziale taglio dei tassi negli Stati Uniti potrebbe indebolire il dollaro e limitare il potenziale di rialzo del Kiwi.
La coppia ha nuovamente raggiunto il suo recente livello massimo, ma è stata respinta vicino al suo recente livello massimo per le ultime quattro volte. Il MACD scorre piatto vicino alla linea dello zero, mentre l'RSI si aggira vicino al livello 50, il che fornisce un segnale neutrale per la coppia.
Livello di resistenza: 0,6150, 0,6205
Livello di supporto: 0,6100, 0,6050
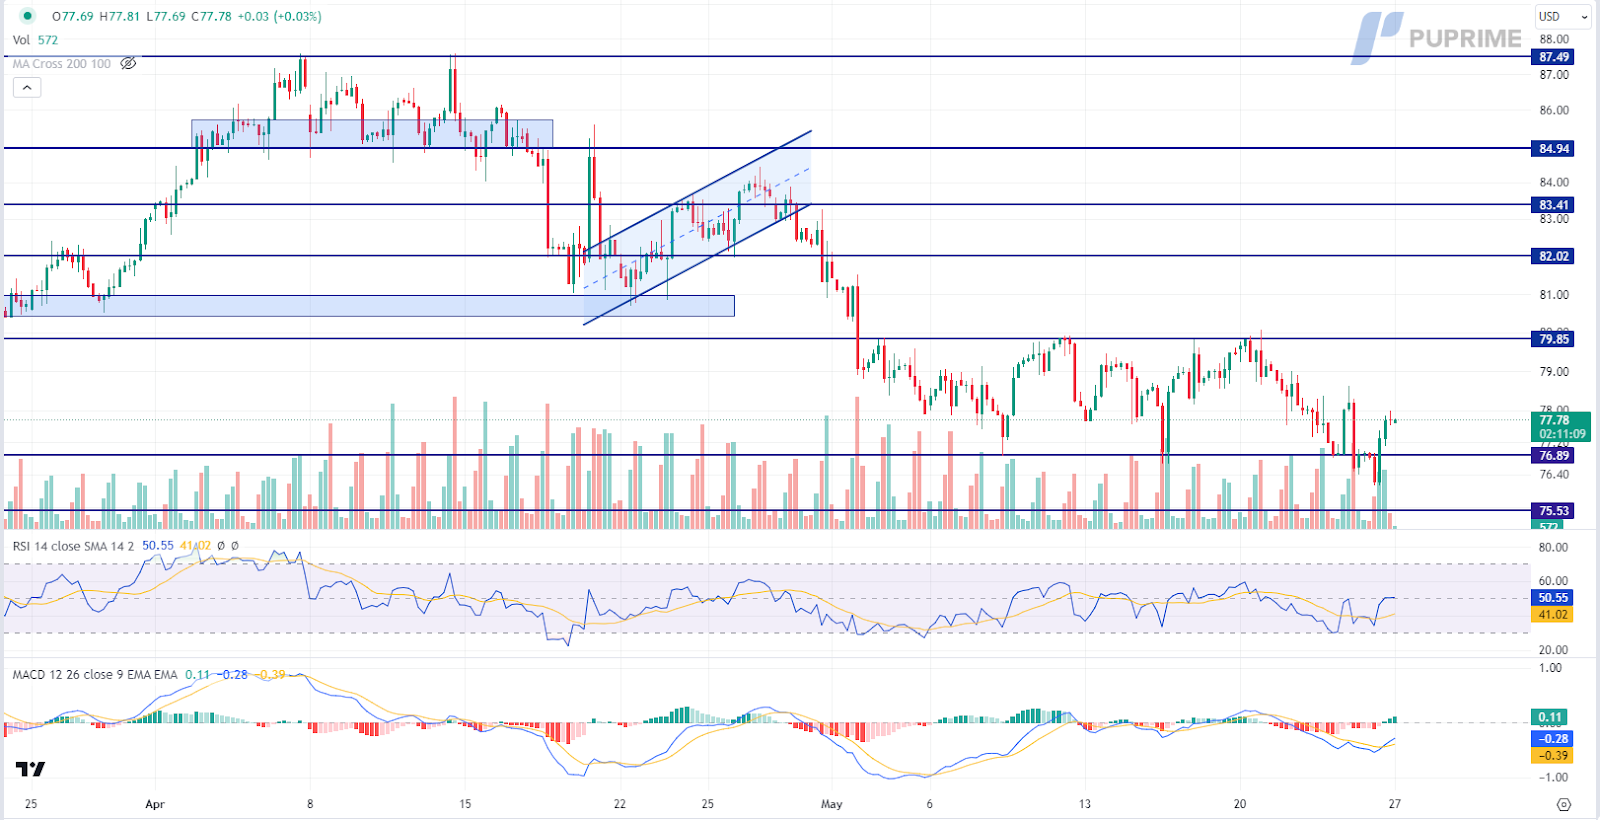
OLIO CL, H4
I prezzi del greggio hanno registrato un leggero rimbalzo venerdì, ma hanno registrato perdite settimanali tra i timori che i solidi dati economici statunitensi e le aspettative da falco della Fed possano smorzare la domanda di petrolio. I verbali dell'ultima riunione della Fed hanno rivelato che i responsabili politici si chiedono se i tassi attuali siano abbastanza alti da frenare l'inflazione persistente, suggerendo un potenziale rallentamento dell'economia. Tuttavia, le perdite sul mercato del petrolio sono state mitigate dall'attesa della riunione dell'OPEC+ del 2 giugno, in cui il gruppo discuterà l'estensione dei tagli volontari alla produzione di 2,2 milioni di barili al giorno. Gli operatori di mercato osservano con attenzione eventuali segnali da parte del gruppo di produttori.
I prezzi del petrolio sono in rialzo dopo il precedente rimbalzo dal livello di supporto. Il MACD ha mostrato un crescente slancio rialzista, mentre l'RSI è a 51, suggerendo che la commodity potrebbe estendere i suoi guadagni dal momento che l'RSI è rimbalzato bruscamente dal territorio di ipervenduto.
Livello di resistenza: 79,85, 82,00
Livello di supporto: 76,90, 75,55
Inizia a Fare Trading con un Vantaggio
Scambia forex, indici, metalli e altro ancora a spread bassi e con un'esecuzione fulminea.
Inizia a fare trading con depositi a partire da $50 sui nostri conti standard.
Ottieni accesso all'assistenza 24/7
Accedi a centinaia di strumenti, a strumenti didattici gratuiti e ad alcune delle migliori promozioni in circolazione.
Il Sito è destinato a persone residenti in giurisdizioni in cui l'accesso al Sito è consentito dalla legge.
Si prega di notare che PU Prime e le sue entità affiliate non hanno sede né operano nella giurisdizione del vostro paese.
Facendo clic sul pulsante "Riconosci", l'utente conferma di essere entrato in questo sito web esclusivamente su sua iniziativa e non come risultato di una specifica attività di marketing. Desiderate ottenere informazioni da questo sito web che sono fornite su sollecitazione inversa in conformità con le leggi della vostra giurisdizione.
Tenete presente che il sito web è destinato a persone che risiedono in giurisdizioni in cui l'accesso al sito web è consentito dalla legge.
Tieni presente che PU Prime e le sue entità affiliate non sono stabilite né operano nella tua giurisdizione di origine.
Facendo clic sul pulsante "Accetta", si conferma che si sta accedendo a questo sito web per iniziativa propria e non come risultato di alcuno sforzo di marketing specifico. Desideri ottenere informazioni da questo sito web che ti vengono fornite tramite una richiesta inversa in conformità con le leggi della tua giurisdizione di origine.