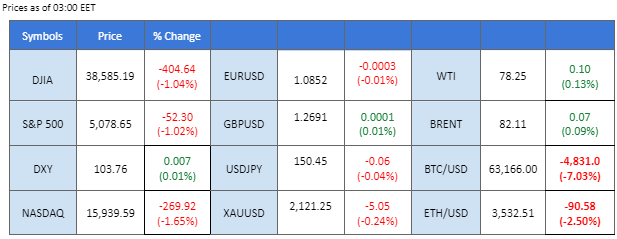
* U.S. equity markets pulled back from a previous AI rally ahead of the Fed’s testimony.
* Gold prices are approaching their all-time high levels, fueled by risk-off sentiment.
* BTC plunged more than 10% after it traded beyond its all-time high at $68980.
Sintesi del mercato
U.S. equity markets are showing signs of fatigue after a two-week AI-driven rally that propelled major indexes to record highs. The spotlight is on Federal Reserve Chair Jerome Powell’s two-day testimony, starting today, which could significantly impact global financial markets as investors seek insights into the Fed’s upcoming monetary policy decisions. In parallel, gold prices have surged to all-time highs, fueled by a prevailing risk-off sentiment. Simultaneously, BTC, often referred to as the gold in the crypto market, experienced volatility, reaching all-time highs before retreating due to profit-taking and panic selling. Meanwhile, Japan’s largest bank, Mitsubishi UFJ Financial Group, is strategically positioning itself in anticipation of a potential shift in the Bank of Japan’s (BoJ) monetary policy. Speculation revolves around the BoJ possibly making its first rate hike in decades, a move that could influence the strength of the Japanese Yen against other currencies.
Le attuali scommesse sul rialzo dei tassi 20 marzo Decisione sui tassi di interesse della Fed:
Fonte: Strumento Fedwatch del CME
0 bps (95%) VS -25 bps (5%)
Panoramica del mercato
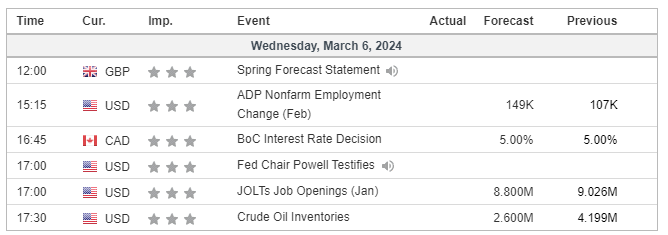
Calendario economico
(Tempo del sistema MT4)
Fonte: MQL5
Movimenti di mercato
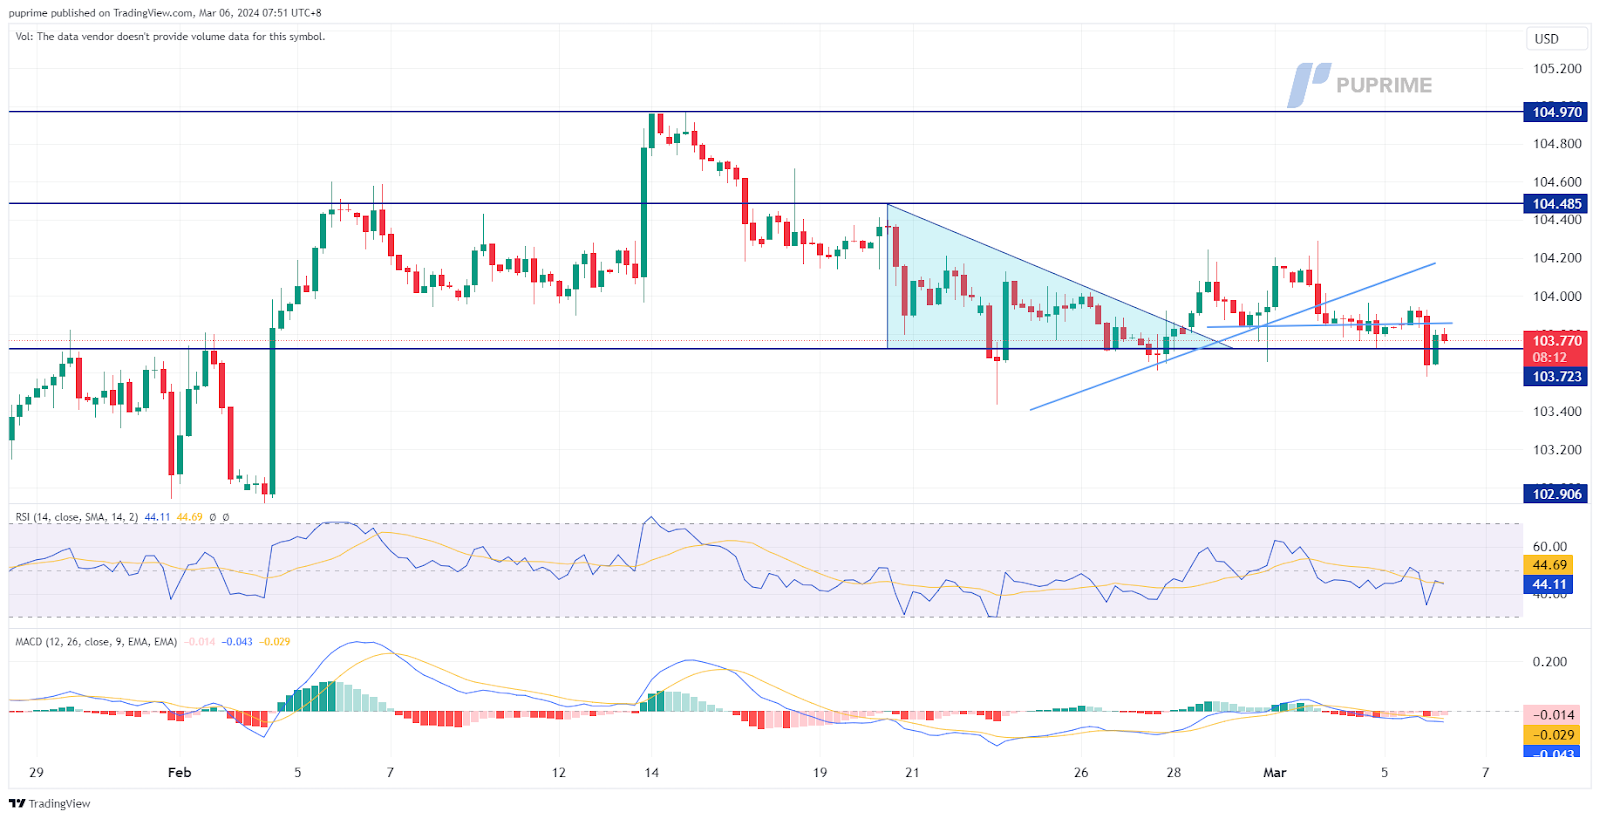
DOLLARO_INDICE, H4
The Dollar Index faced downward pressure, slipping below 103.85 in the last session. Investors seem to be swayed by recent lacklustre economic data from the United States, indicating a potential slowdown in economic growth. This sentiment prevails despite expectations of relatively hawkish testimony from Federal Reserve Chair Jerome Powell scheduled for today and tomorrow. Powell’s testimony is anticipated to introduce higher volatility to the Dollar Index as market participants keenly await insights into the central bank’s stance amid economic challenges.
The dollar index traded eased from its short-term support level at 103.85, suggesting a shift in the index’s momentum. The RSI is gradually moving lower while the MACD is flowing below the zero line, suggesting a bearish momentum is forming.
Livello di resistenza: 104,50, 104,95
Livello di supporto: 103,70, 102,90
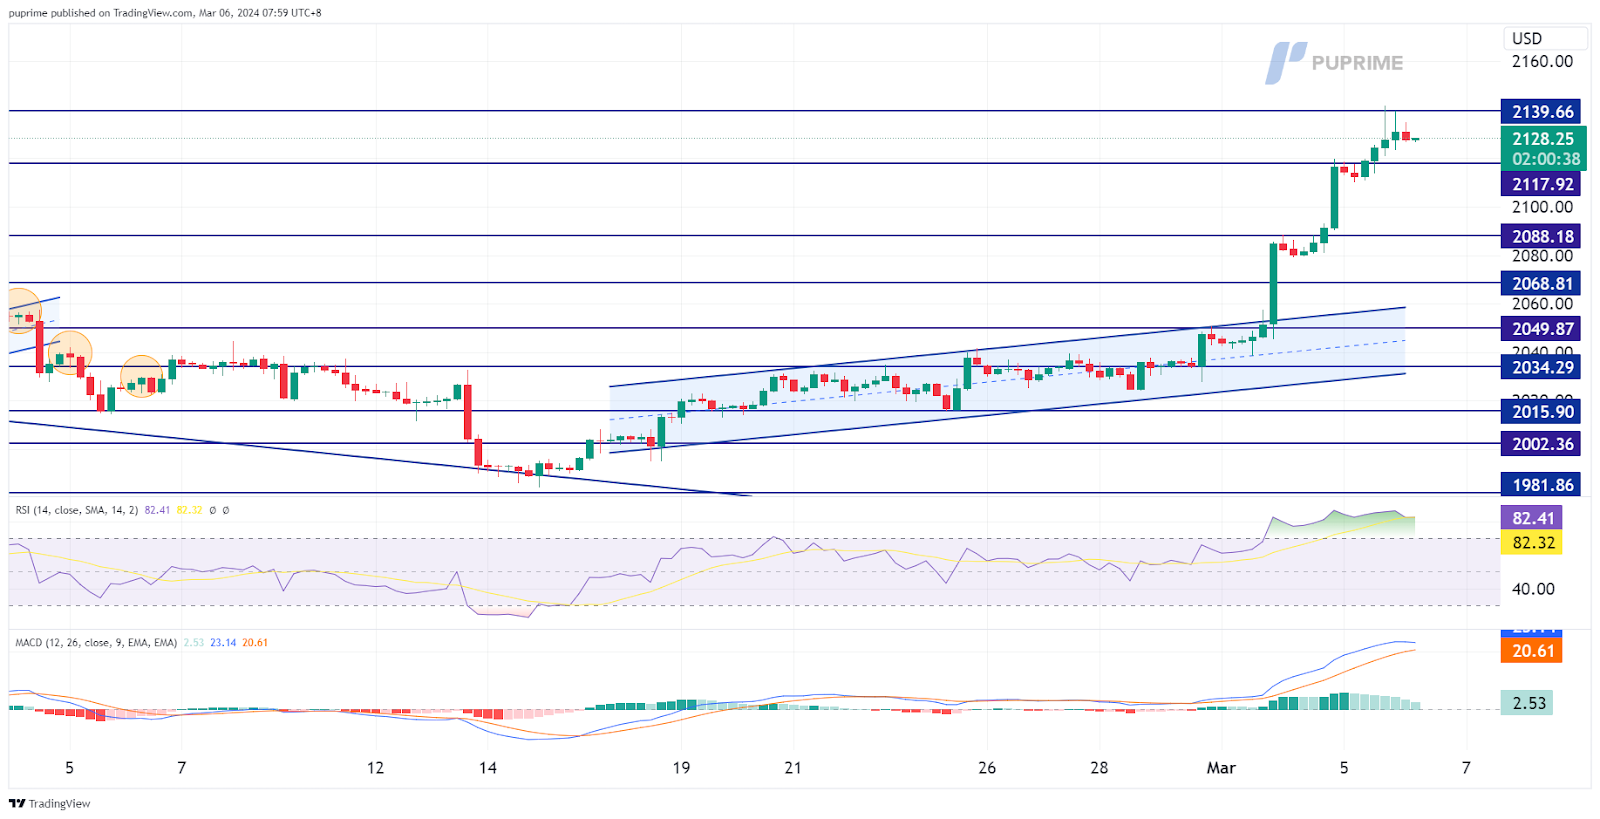
XAU/USD, H4
Gold prices have extended their upward trajectory, surging by over 4% throughout March. The precious metal’s ascent is largely attributed to the prevailing risk-off sentiment in the market, intensifying ahead of the Federal Reserve Chair Jerome Powell’s testimony scheduled for today and tomorrow. Additionally, the growing financial risk associated with a potential pullback in equity markets has further bolstered demand for gold as a safe-haven asset. Investors are closely monitoring Powell’s remarks for insights into the Fed’s stance amid heightened market uncertainty.
Gold prices have risen and are currently holding below its all-time high levels. The RSI continues to be in the overbought zone while the MACD continues to surge, suggesting the bullish momentum remains strong for the gold.
Resistance level: 2140.00, 2155.00
Support level: 2117.90, 2088.20
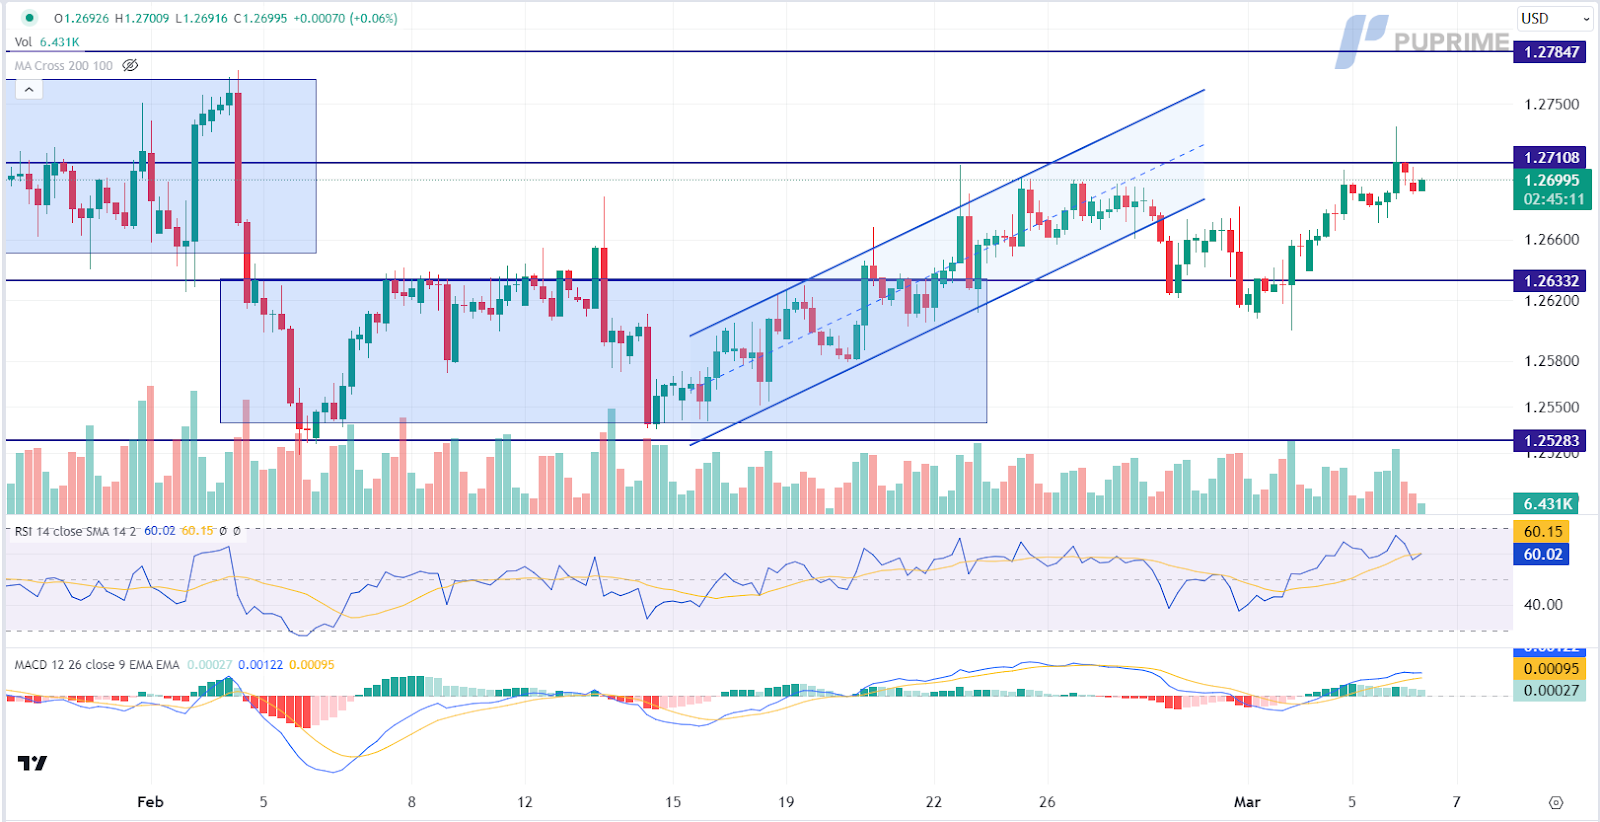
GBP/USD,H4
The Pound Sterling hovers near a crucial resistance level, finding support in the weakening trend of the US Dollar. Wednesday’s spotlight includes the UK S&P Global Construction PMI and Federal Reserve (Fed) Chairman Jerome Powell’s testimony. UK Chancellor Jeremy Hunt’s insights into the Spring Budget, featuring a proposed national insurance cut, are pivotal for investors navigating potential trading signals. Diligent monitoring of budget updates is advised.
GBP/USD is trading higher while currently testing the resistance level. MACD has illustrated diminishing bullish momentum, while RSI is at 60, suggesting the pair might experience technical correction since the RSI retreated sharply from overbought territory.
Resistance level:1.2710, 1.2785
Support level: 1.2635, 1.2530
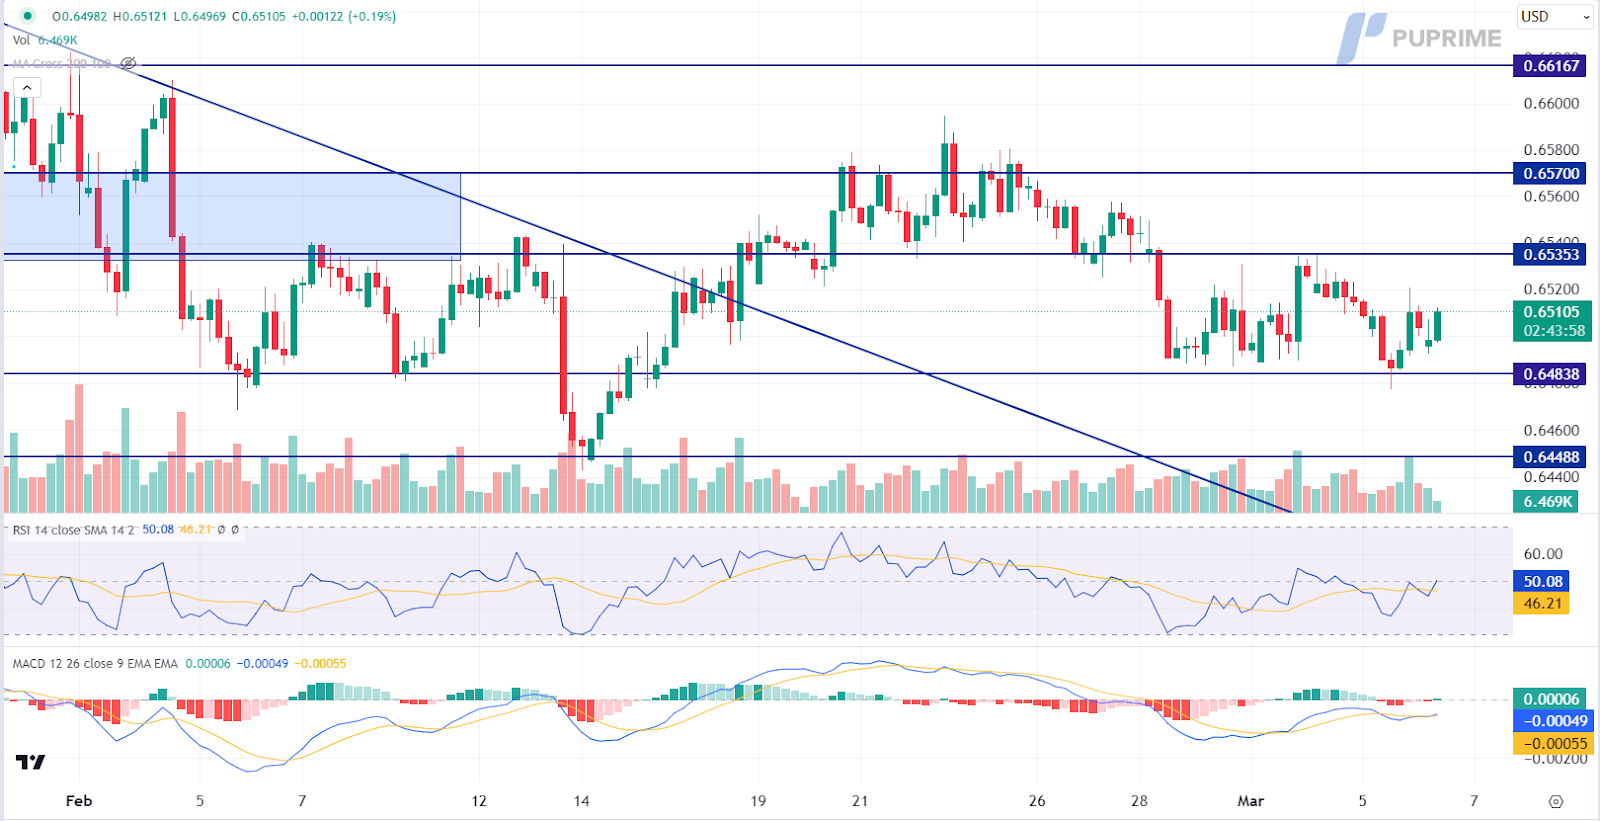
AUD/USD,H4
AUD/USD maintains a steady stance amidst mixed market sentiment in Australia. The ongoing downtrend in the US Dollar offers a potential bullish push for AUD/USD, yet uncertainties surrounding the Chinese economy, a significant trade partner for Australia, present headwinds. While potential stimulus measures in China may offer temporary relief, the sustainability of economic conditions remains uncertain. Investors are urged to closely monitor further developments for trading signals.
AUD/USD is trading higher following the prior rebound from the support level. MACD has illustrated diminishing bearish momentum, while RSI is at 50, suggesting the pair might extend its gains in short-term since the RSI rebounded sharply from oversold territory.
Resistance level: 0.6535, 0.6570
Support level: 0.6485, 0.6450
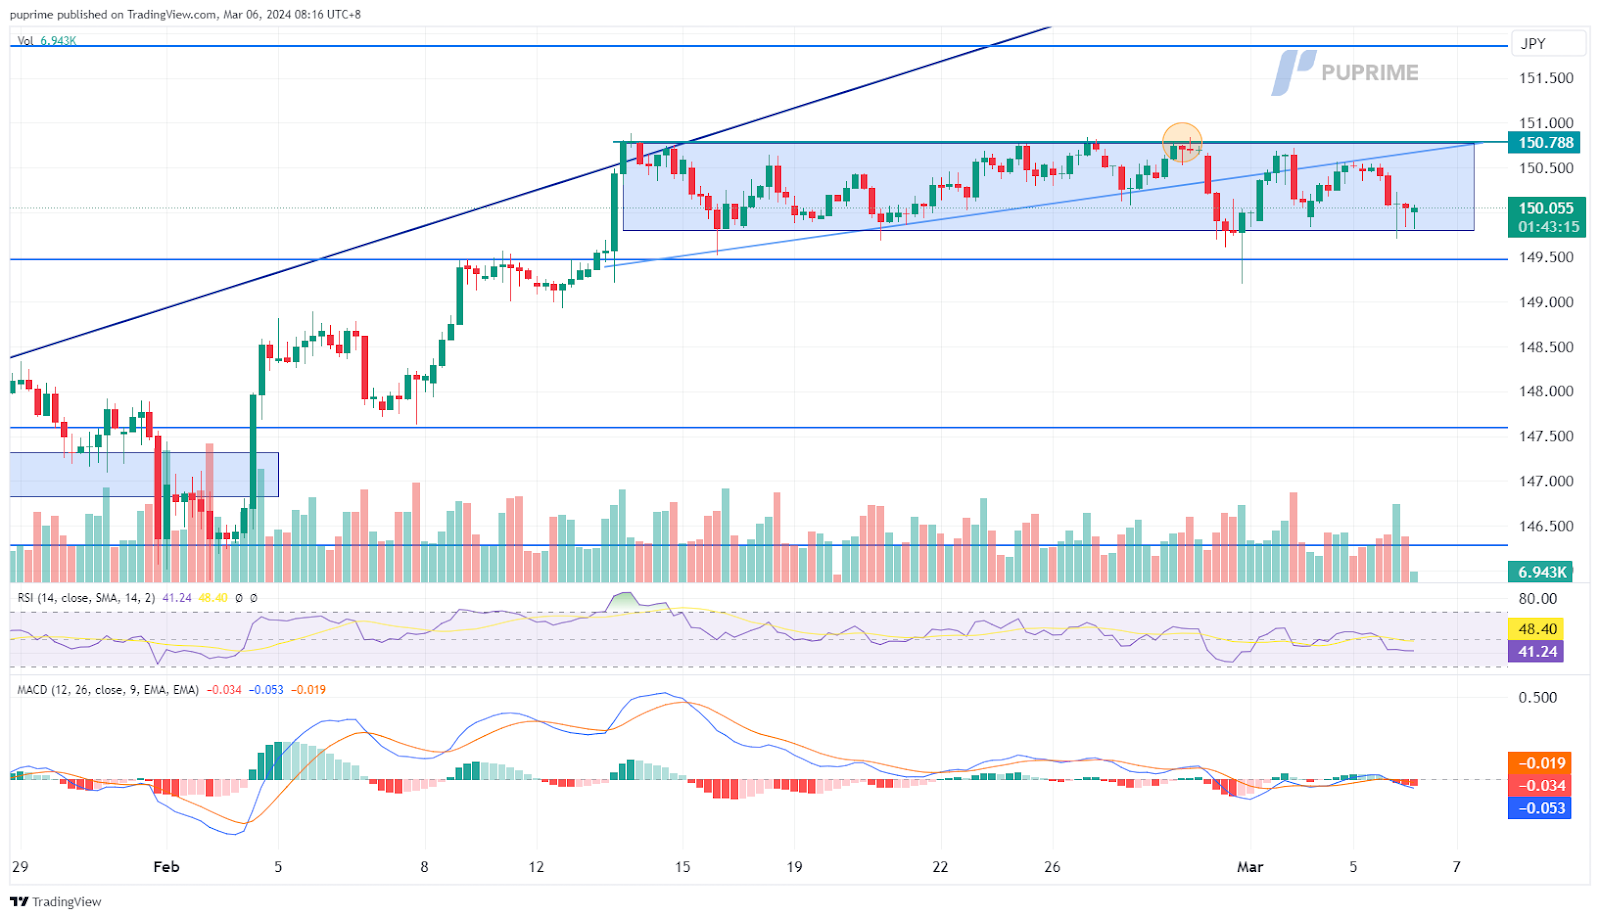
USD/JPY, H4
The USD/JPY pair continues to trade within a consolidation range, fluctuating between the 150.80 and 149.75 levels. Notably, Mitsubishi UFJ Financial Group, Japan’s largest bank, is reportedly adjusting its positions in anticipation of a potential move by the Bank of Japan (BoJ) in March. Senior management at the bank has suggested that there is a 50% chance the BoJ may shift its monetary policy, a move that could have significant implications for Japanese government bonds and the strength of the Japanese Yen.
USD/JPY eases slightly but remains trading sideways within its consolidation range. The RSI is moving near the 50 level while keeping below the zero line, suggesting bearish momentum may be forming.
Resistance level: 150.80, 151.70
Support level: 149.40, 147.60
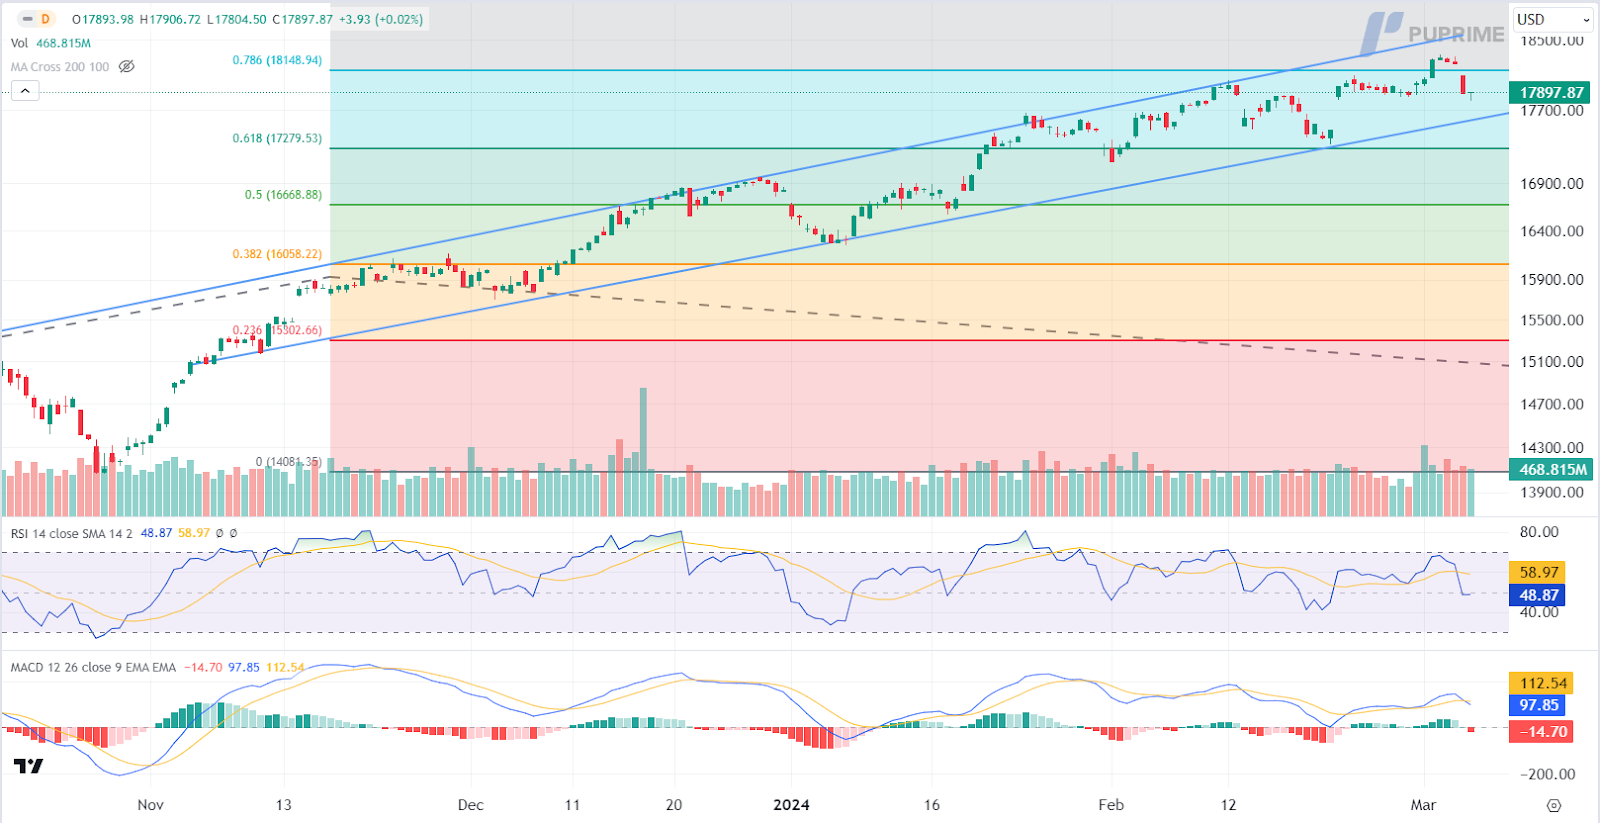
NASDAQ, H4
Wall Street’s major indexes experience significant retreat, influenced by weakness in mega cap growth companies, including Apple Inc, and persistent challenges in the chip sector, dampening the appeal of the US equity market. Ongoing uncertainties, coupled with crucial economic data releases later in the week, shift market sentiment towards safe-haven assets, diminishing the allure of equities. Investors anxiously await Powell’s testimony and scrutinise economic data, including the pivotal non-farm payrolls report on Friday, for insights into interest rate policy.
Nasdaq is trading lower following the prior retracement from the resistance level. MACD has illustrated increasing bearish momentum, while RSI is at 49, suggesting the index might extend its losses since the RSI retreated sharply from overbought territory.
Resistance level: 18150.00, 19255.00
Support level: 17280.00, 16670.00
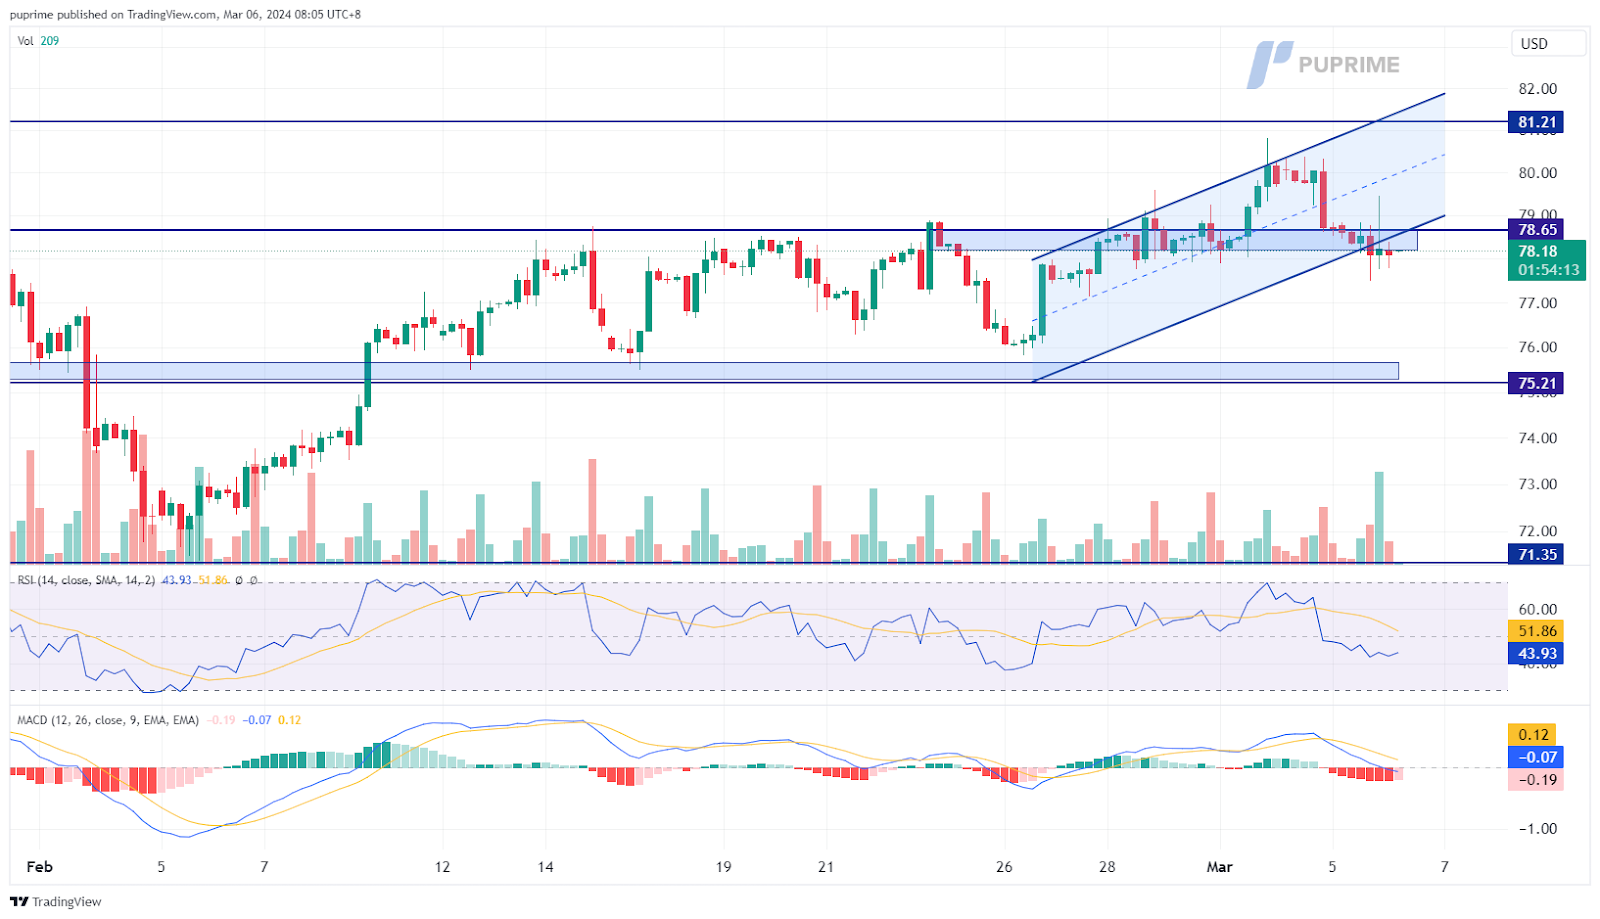
OLIO CL, H4
Oil prices experienced a downturn, facing substantial pressure from the prevailing risk-off sentiment in the market, particularly in anticipation of the Federal Reserve Chair Jerome Powell’s testimony scheduled for today. The heightened uncertainty has led to minimal volatility in oil prices as traders await the outcomes of the ongoing China People’s Congress meeting, recognizing the potential impact of China’s policies on oil prices.
Oil prices have declined to their support level of 78.65, which is a potential rebound level. The RSI has declined to near the 50 level while the MACD has crossed on the above and is approaching the zero line suggesting a bearish momentum is forming.
Resistance level: 81.20, 84.10
Support level: 78.65, 75.20
Inizia a Fare Trading con un Vantaggio
Scambia forex, indici, metalli e altro ancora a spread bassi e con un'esecuzione fulminea.
Inizia a fare trading con depositi a partire da $50 sui nostri conti standard.
Ottieni accesso all'assistenza 24/7
Accedi a centinaia di strumenti, a strumenti didattici gratuiti e ad alcune delle migliori promozioni in circolazione.
Il Sito è destinato a persone residenti in giurisdizioni in cui l'accesso al Sito è consentito dalla legge.
Si prega di notare che PU Prime e le sue entità affiliate non hanno sede né operano nella giurisdizione del vostro paese.
Facendo clic sul pulsante "Riconosci", l'utente conferma di essere entrato in questo sito web esclusivamente su sua iniziativa e non come risultato di una specifica attività di marketing. Desiderate ottenere informazioni da questo sito web che sono fornite su sollecitazione inversa in conformità con le leggi della vostra giurisdizione.
Tenete presente che il sito web è destinato a persone che risiedono in giurisdizioni in cui l'accesso al sito web è consentito dalla legge.
Tieni presente che PU Prime e le sue entità affiliate non sono stabilite né operano nella tua giurisdizione di origine.
Facendo clic sul pulsante "Accetta", si conferma che si sta accedendo a questo sito web per iniziativa propria e non come risultato di alcuno sforzo di marketing specifico. Desideri ottenere informazioni da questo sito web che ti vengono fornite tramite una richiesta inversa in conformità con le leggi della tua giurisdizione di origine.